Free In-Depth Look At Our Nightly Algo Report
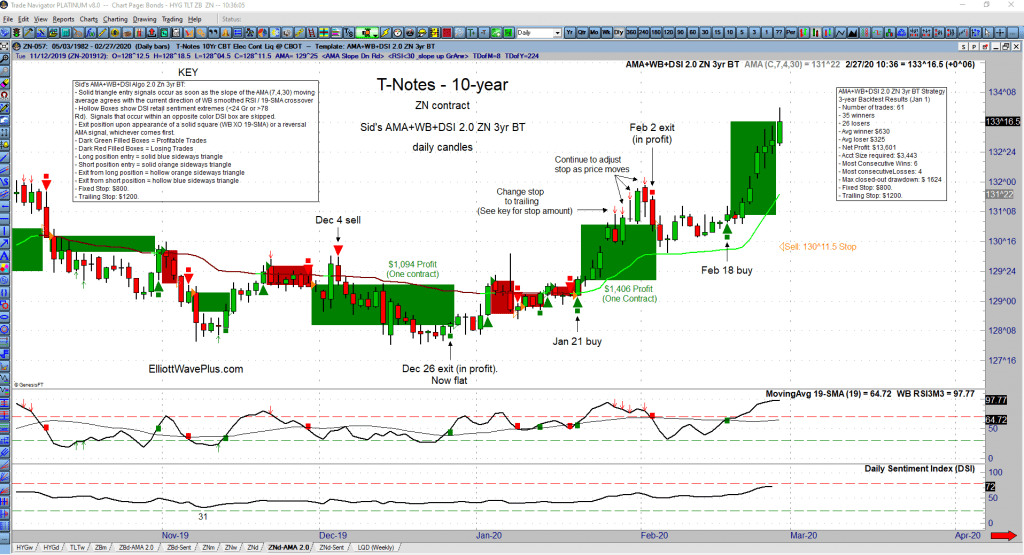
We’d like to give you a more in depth look at an AMA momentum algo chart that our Premium Plan subscribers received last night, as well as the associated sentiment conditions screenshot and PDF “quick check” summary. All of those items are provided to to Premium Plan subscribers nighty (M-F).
Who Could Have Predicted This Huge Down Move In The Market?

On November 15, 2019, the S&P-500 reached 3120 for the first time ever. For the next 63 trading days, the S&P continued relentlessly higher, topping on Feb 19 at 3393. Just four days later, the S&P was back down to 3120, almost instantly erasing three full months of gains! Nobody could have seen that coming ahead of time, could they? We know of at least one person who did.
Have We Reached An Unsustainable Situation?

Gold & Bonds are typically correlated. As of this writing, that historic relationship appears to be intact. Compare that to Gold & the U.S dollar. Those two items typically move opposite (inverse) of each other. However, since mid-July 2019, they have generally been moving up and down together.
Bonds, which are the most popular alternative to stock ownership in the investment world, typically move opposite of the stock market. However, ever since the start of the new year (2020), stocks, bonds, gold and the US Dollar have all been rallying together. Is this a distortion that has developed because of mid-October 2019 Fed announcement of QE? Many think so. If so however, there was a delayed reaction of 2.5 months.
Is The Stock Market Losing Upward Momentum?
The most publicized stock market indices continue to hover near all-time highs, but is this market losing momentum? The answer is YES. Examine the following multi-timeframe screenshots of the Dow Jones Industrial Average (DJIA) with a standard RSI indicator on the bottom of the screen. The loss of momentum is clearly shown in the form of bearish RSI divergence.
Is a Dow Theory Non-Confirmation In Play?
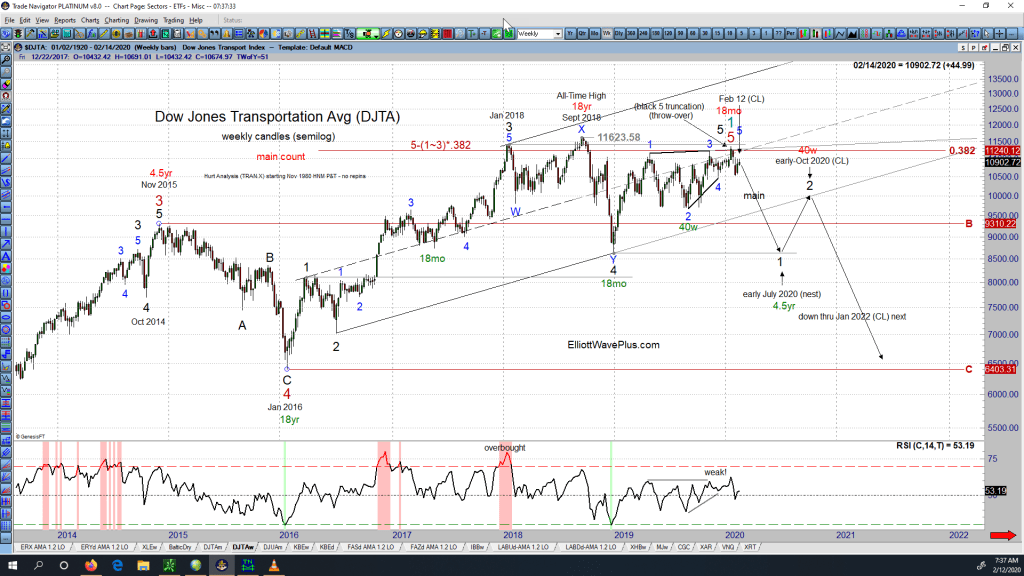
The original Dow Theory states that the market is in an upward trend if either the industrial or transportation index advances above a previous important high and is accompanied or followed by a similar advance in the other average. For example, if the Dow Jones Industrial Average (DJIA) climbs to a new all-time high, and the Dow Jones Transportation Average (DJTA) follows suit within a reasonable period of time, the upward trend is confirmed.

