[vc_row][vc_column][vc_column_text css=”.vc_custom_1599157686467{margin-bottom: 0px !important;}”]
The VIX Predicted a Downturn in the Market
Volatility Index Coverage – Webinar Video Excerpt
[/vc_column_text][mk_divider style=”shadow_line” margin_top=”1″ margin_bottom=”30″][vc_column_text css=”.vc_custom_1599176524480{margin-bottom: 0px !important;}”]
Elliott Wave Plus
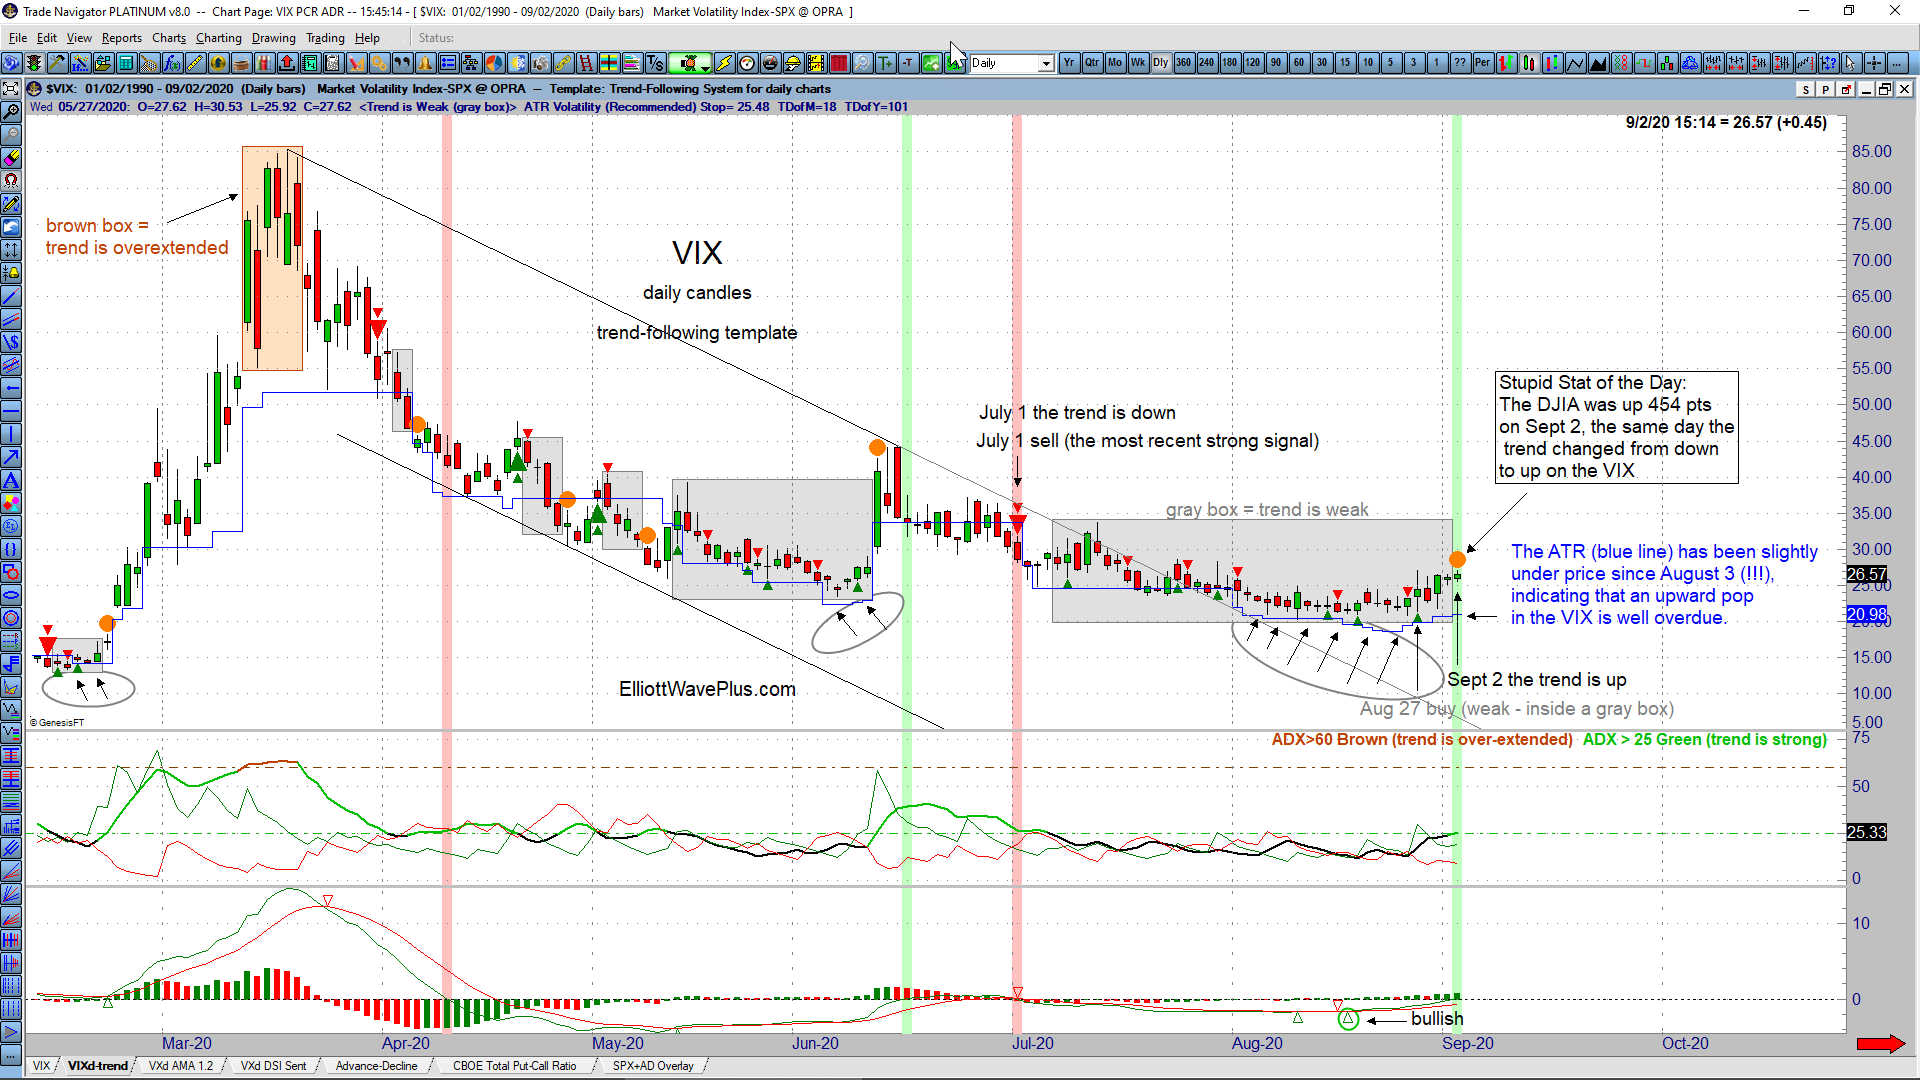
The VIX (volatility index) represents the market’s expectations for volatility. Many traders refer to it as the “fear index” because it can be used to measure risk in the market. If the VIX is moving up, this can be an indicative of stress, and usually coincides with an upcoming downturn in the market.
For the past few weeks, the VIX has managed to create a floor around 20 and has refused to move below this mark. This is unusual during an up-trending stock market like we have been seeing lately. Take a look at this screenshot of the VIX daily trend chart from Sept 2, 2020:
The video excerpt below is from the August 30, 2020 webinar. Our presenter, Sid Norris, goes into detail about current market conditions and lets subscribers know that being bullish could be troublesome.
What was the outcome?
As of September 3, the VIX was up 20% in just one day. The S&P-500 was down nearly 4%, and the DJIA was down 3%.[/vc_column_text][/vc_column][/vc_row][vc_row][vc_column][vc_column_text css=”.vc_custom_1597086316993{margin-bottom: 0px !important;}”][/vc_column_text][vc_column_text css=”.vc_custom_1598299978844{margin-bottom: 0px !important;}”][/vc_column_text][mk_divider style=”shadow_line” margin_top=”0″ margin_bottom=”30″][vc_column_text css=”.vc_custom_1597090110759{margin-bottom: 0px !important;}”]
About Elliott Wave Plus
Timing is everything! Considering our Elliott Wave & Hurst Cycle analysis in conjunction with these algorithmic trend-following trade signals can help traders decide when to get in and get out. Future Elliot Wave / Hurst Cycle road maps alongside trend-following trade signals can aid in navigating these rough waters. Please check out our resources page for lots of educational content.[/vc_column_text][mk_divider style=”shadow_line” margin_top=”10″ margin_bottom=”10″][vc_column_text css=”.vc_custom_1597091662031{margin-bottom: 0px !important;}”]
Subscriptions: We offer a number of subscription levels. Our unique approach is well worth considering, especially if you’ve never experienced wave labeling and associated Fibonacci price targets, in conjunction with independent Hurst cycle analysis. Here’s more info about subscribing to any of our plans.
Be sure to subscribe at our YouTube channel. Look for an announcement soon regarding our new regular podcasts.
Follow us on Twitter & Facebook.
(There is risk of loss in all trading. See the full disclaimer at our site.)[/vc_column_text][vc_column_text css=”.vc_custom_1599162604716{margin-bottom: 0px !important;}”]Testimonials:
“Wow… that was excellent… by far the best webinar/presentation on the financial markets I have ever seen! The grasp you have on all of the markets and financial news is remarkable. Thank you very much for your work.” –
“I’ve been trading these markets (and subscribing to professional services) for more than forty years and find your work and resulting forecasts, targets, objectives, etc. to be free of personal bias, and remarkably accurate. That is why I continue to subscribe. Well done.” –
Click here for many more testimonials spanning the last ten plus years.[/vc_column_text][/vc_column][/vc_row][vc_row][vc_column][/vc_column][/vc_row]

