Did a 9-yr cycle trough just occur in the NZD/USD currency pair?
I’ve been tracking the NZD/USD currency pair using both the Hurst nominal model and the gold 7.4-yr model for quite some time now. One would think that this pair would work nicely with the 7.4-yr gold model, since gold and the down-under currency pairs are typically highly correlated.
Here’s the Sentient Trader (Hurst nominal model) analysis starting May 1993, with the last 4.5-yr cycle trough pinned to the 2013 low, troughs only, with composite line:

And here’s the same Sentient analysis, this time using combined peak & trough analysis:

For comparison, here is how the 7.4-yr gold model phases the pair, with no repinning (peaks & troughs):

While the phasing using the gold model is fairly even, it places a 9-yr (12.7yr actual) cycle trough at the Nov 2011 dip, and not at the 2009 low. This difference between the gold model analysis and the Hurst nominal model analysis makes the Hurst nominal model the preferred model for this pair, in my opinion.
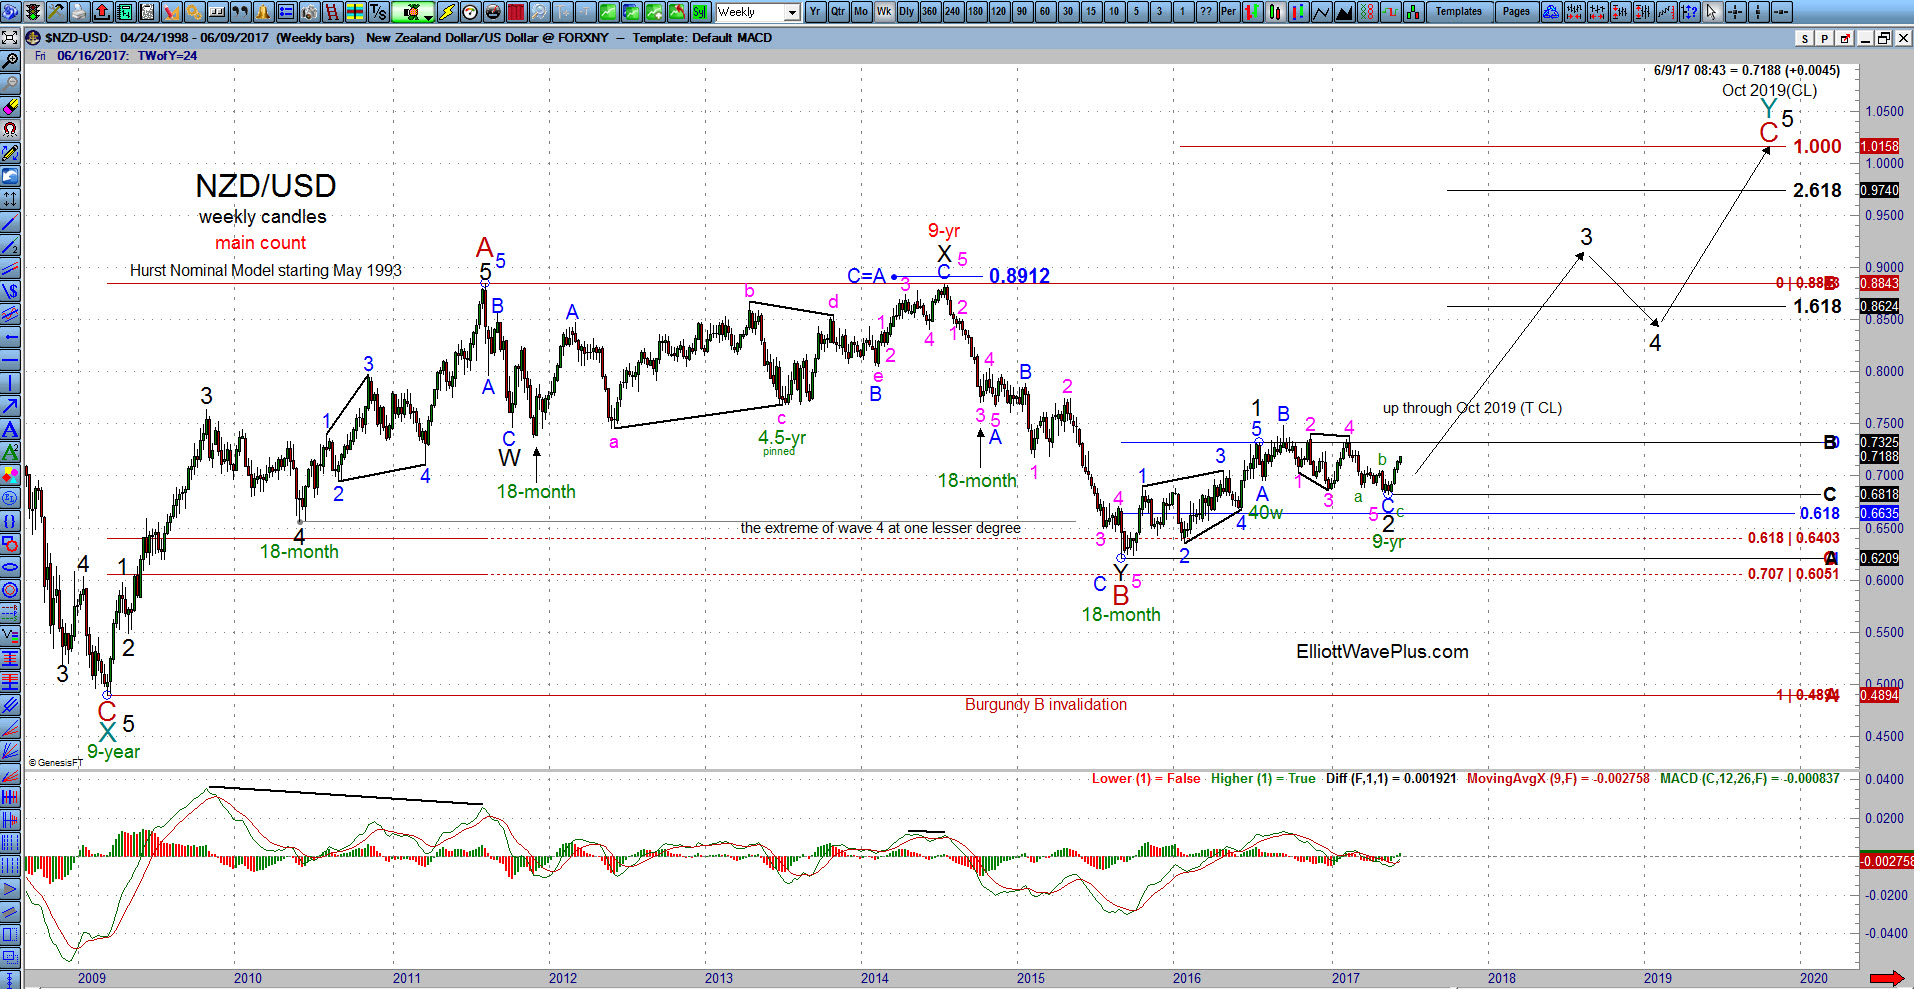
I combine Hurst and Elliott, so using the Hurst nominal model phasing as a guide, here’s my resulting wave count on a weekly chart (troughs only):
And here’s a closer-up view of recent price action, on a daily chart.

Notice the 5-waves up from the May 11 low.
If this interpretation is correct, There are bullish ramifications for the metals and mining sector. It also suggests that we may be nearing an inflationary period. One caveat: This currency pair led its companion pair AUD/USD and Gold off their late 2015 – early 2016 bottoms by several months. The Kiwi bottomed in Aug 2015, while the Aussie bottomed five months later in Jan 2016. Gold and silver bottomed in Dec 2015. So this pair may act once again as a leading indicator for metals, mining, and inflation.
Sid