A Chartist’s View of New Gold Inc. (ticker NGD)
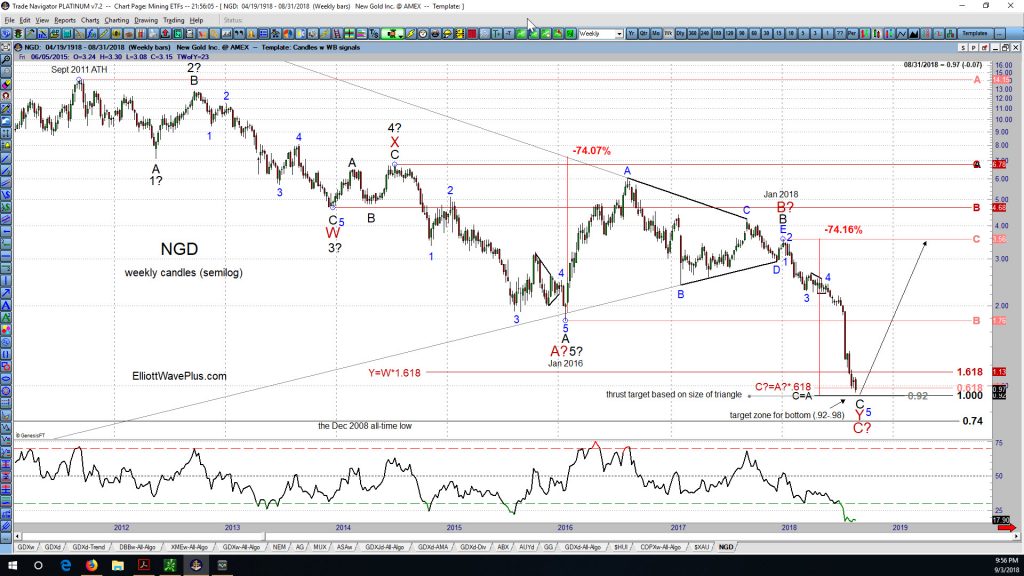
New Gold Incorporated is a mid-tier gold mining company with mining operations in Canada, the U.S. and Mexico. NGD stock made its all-time low of 74 cents per share in December 2008, and its all-time high of $14.15 per share in September 2011. New Gold is one of the holdings in the two most popular gold mining ETF’s, GDX and GDXJ. Its annual revenue is currently about $725 million. Let’s examine a chart of NGD starting at the 2011 high from a technical point of view. (Click on the chart to enlarge).
From an Elliott Wave perspective, the downward movement from the 2011 is corrective. It counts nicely as either a double zigzag (WXY), or a simple zigzag (ABC). The most important pattern on the chart (using either wave count) is the triangle from January 2016 through January 2018, followed by a thrust to the downside. Thrusts from triangles are the final wave of any EW pattern, and often create a “blood in the streets” emotional condition.
There are two methods of setting targets for the end of a thrust from a triangle. One is based on the size of the triangle at the start of the triangle pattern, and the other is based on the expectation of a Fibonacci relationship with a prior wave.
As you can see on the chart, if the main count of a double zigzag is correct, within burgundy (primary degree) wave Y, black C will equal black A at 92 cents. If the alternate count of a single zigzag is correct, burgundy C will equal burgundy A times .618 at 98 cents. Finally, if the thrust reaches its target based on the size of the triangle, NGD will reach 92 cents. This creates a target zone for the end of the terminal thrust of 92 to 98 cents per share. Last week’s low was 95 cents.
For those wanting to put a more bearish slant on the wave count, beware. Triangles cannot appear alone in a wave 2 position. That means that the 2018 plunge cannot be labeled as a large degree 3rd wave.
Once last note: The typical price behavior after a thrust from a triangle is for the entire thrust to be completely retraced. That would have NGD rallying back to $3.56 per share next.
Summary:
Technical analysis suggests that New Gold Inc. (NGD) is very near an important low, and could rally almost 300% next.
Sid Norris – ElliottWavePlus.com

