An Important Large-Cap Gold-Mining Stock (ABX) is Still Searching for a Bottom, by Sid Norris of ElliottWavePlus.com.
The upward movement in Precious Metals and associated mining stocks has been impressive the last couple of weeks. But is the bottom in on the sector? If the ABX chart below is any indication, maybe not quite yet on some individual stocks.
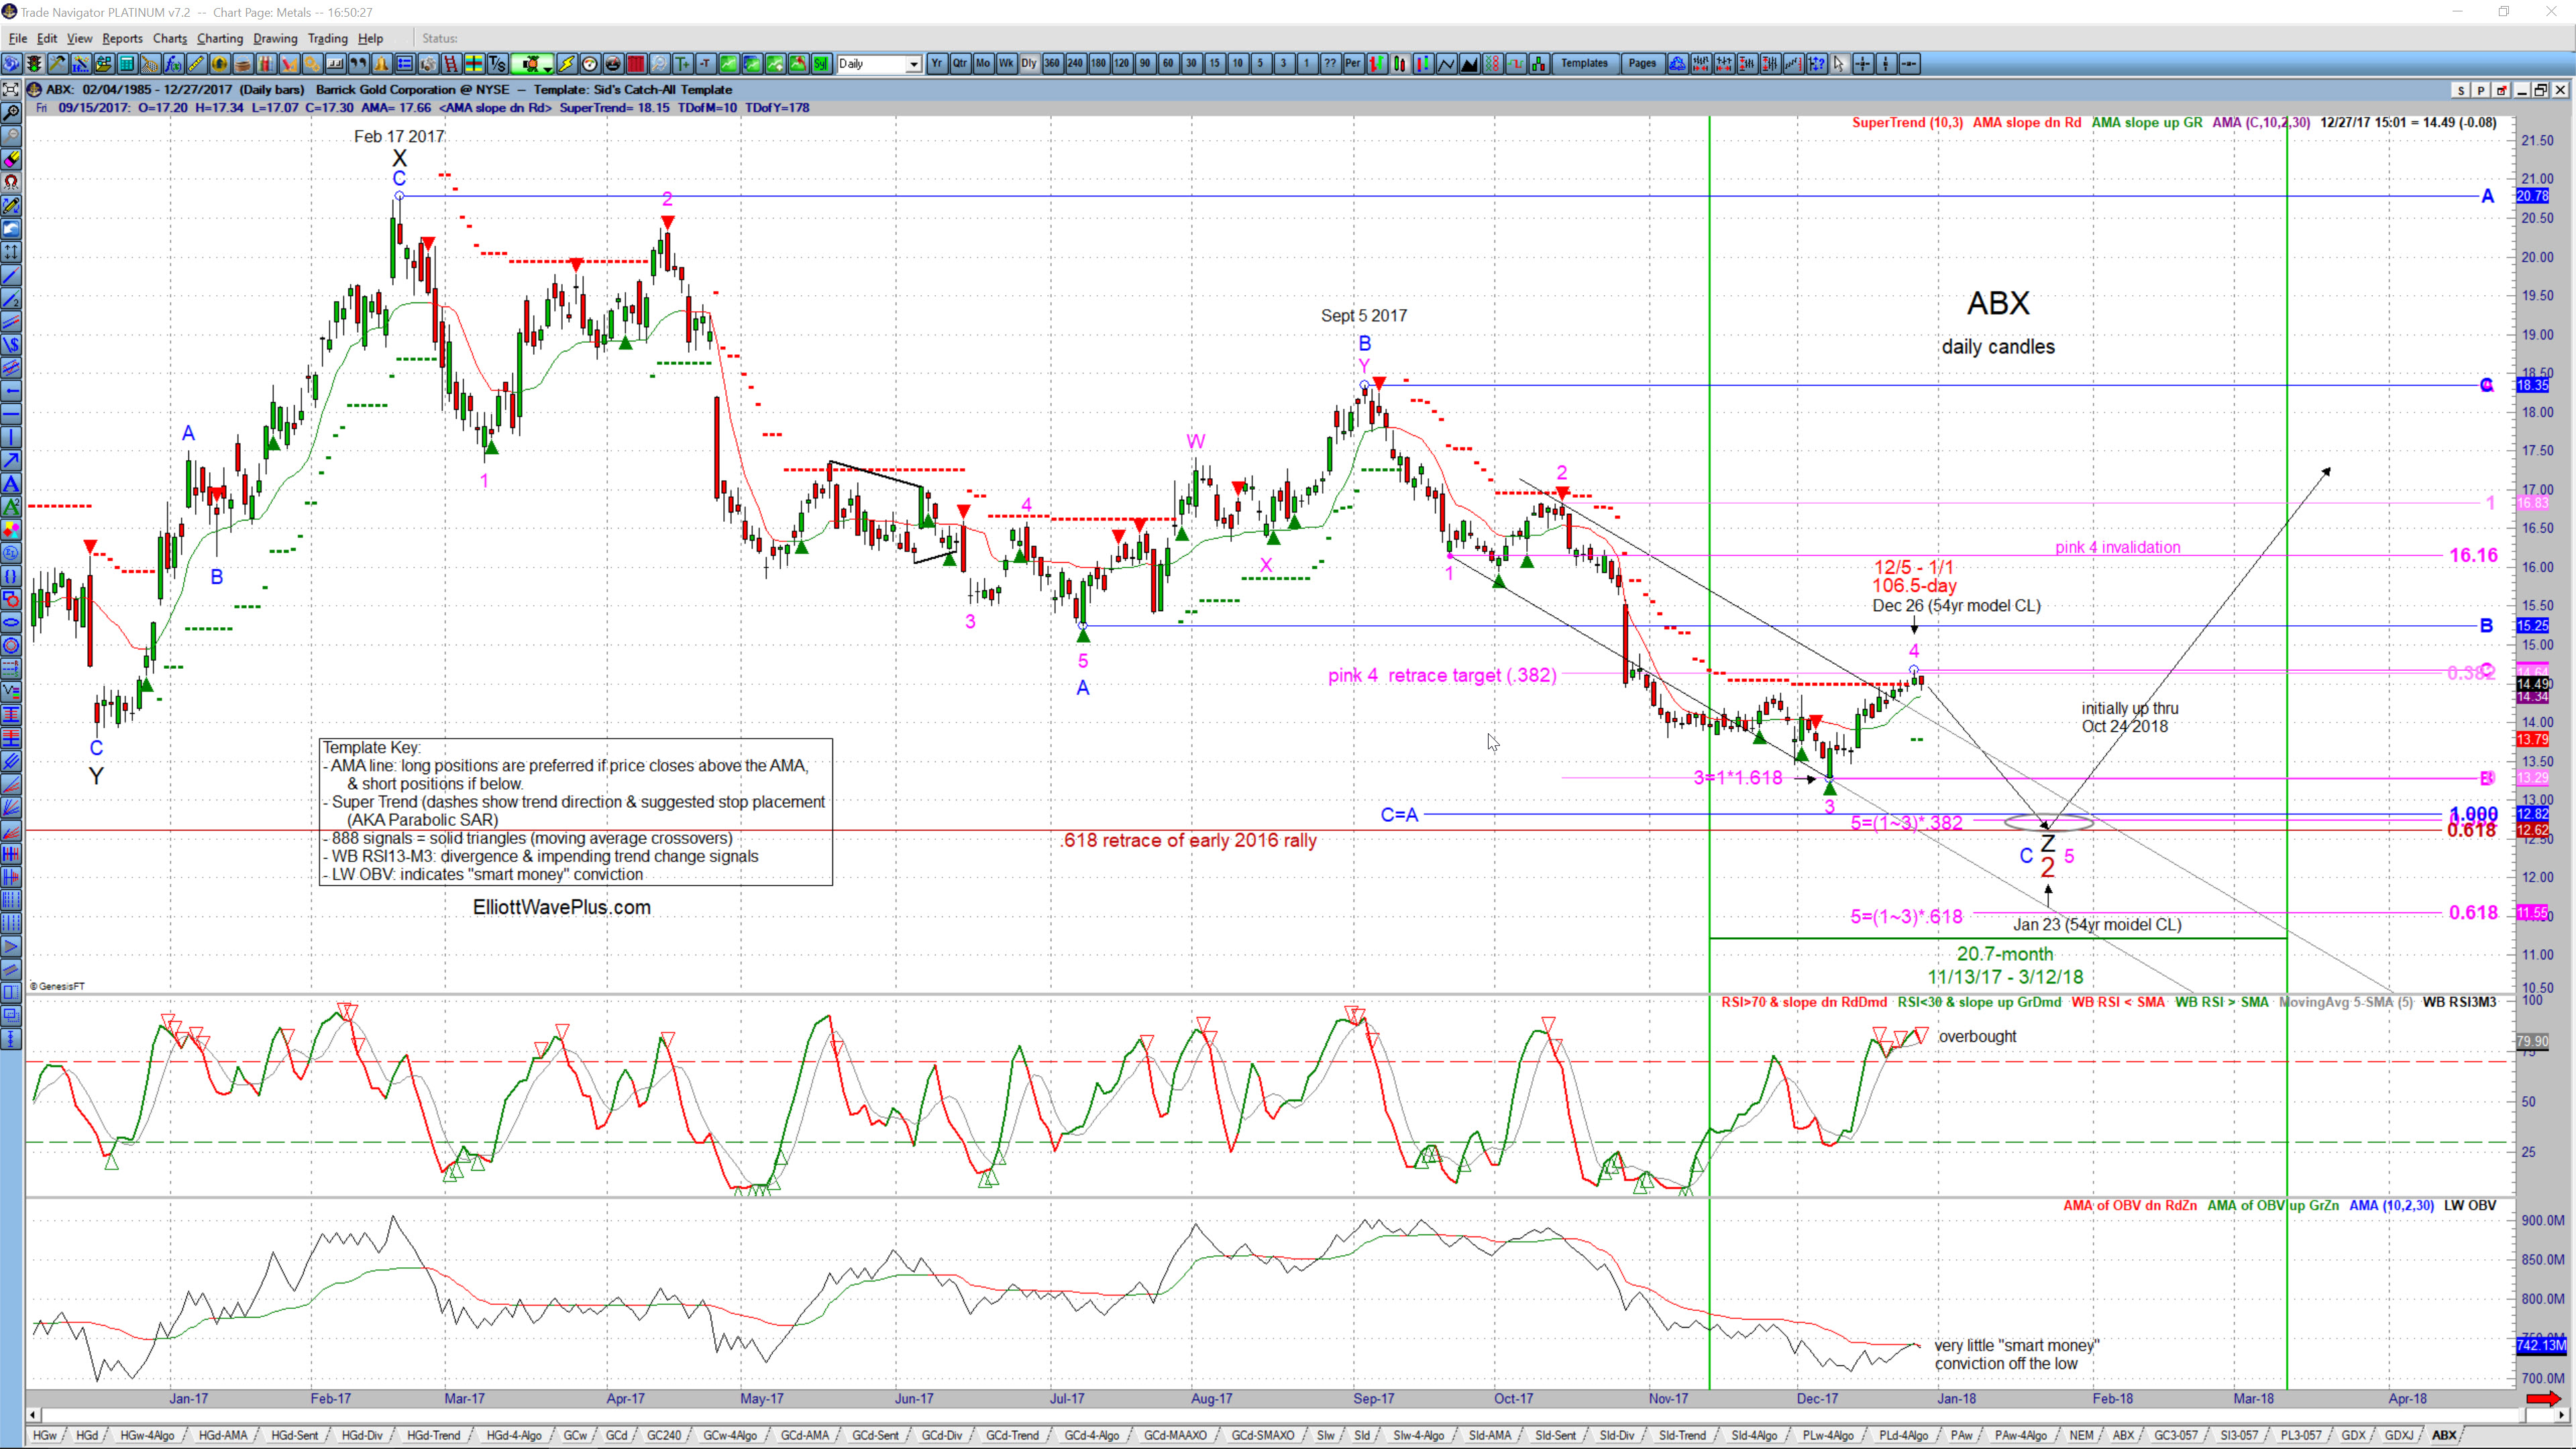
The daily chart (below) of Barrick Gold (ABX) features a new template I’ve been working on, including Perry Kaufman’s Adaptive Moving Average, an excellent trend indicator from Genesis called Super Trend, signals from Jake Bernstein’s latest version (much improved!) of his JTS-888 indicator, the Walter Bressert RSI13M3 indicator, and Larry Williams’ version of Joe Granville’s On Balance Volume (OBV). Also shown is my Elliott Wave count, and associated Fibonacci price targets, as well as a few chart notes derived from a custom 54-yr cyclic model developed using Sentiment Trader software. (Click on the chart to enlarge)
There are six take-a-ways from the chart:
- It appears most likely that ABX needs a 5th wave down (pink) from the Sept 5 high to complete a blue ABC zigzag, starting from the Feb 17 2017 high. Why? Because the December 12 low had a normal wave 3 Fibonacci relationship (1.618) with wave 1 (pink). Also, the rally since December 12 has retraced exactly .382 of pink wave 3, the most common Fibonacci relationship between waves 4 and 3.
- There’s a Fibonacci cluster that would make a nice target zone for the end of pink wave 5 between 12.62 and 12.82. That is where 1) pink wave 5 will equal the net traveled by pink waves 1 through 3 times .382, 2) blue wave C will equal blue wave C, and 3) where burgundy wave 2 will retrace burgundy wave 1 by .618.
- The 54-yr custom cyclic model, which uses 2:1 ratios exclusively from 10-day though 18-year cycles suggests a significant mid-to-late-January low of 20.7-month cycle magnitude.
- The WB-RSI13M3 indicator has been showing a lingering overbought condition since December 18.
- The OBV indicator shows very little “Smart Money” conviction associated with the recent two-week rally.
- A daily 888 sell signal came within an eyelash of firing today, and will likely fire tomorrow if there is any downside follow-though.
Sid Norris – ElliottWavePlus.com