[vc_row][vc_column][vc_column_text css=”.vc_custom_1631832703211{margin-bottom: 0px !important;}”]
Gold Mining Stocks ETF: GDX
Traded with Precision Timing
Elliott Wave Plus
Gold Mining Stock – GDX weekly chart of Sid’s call from March 2021:
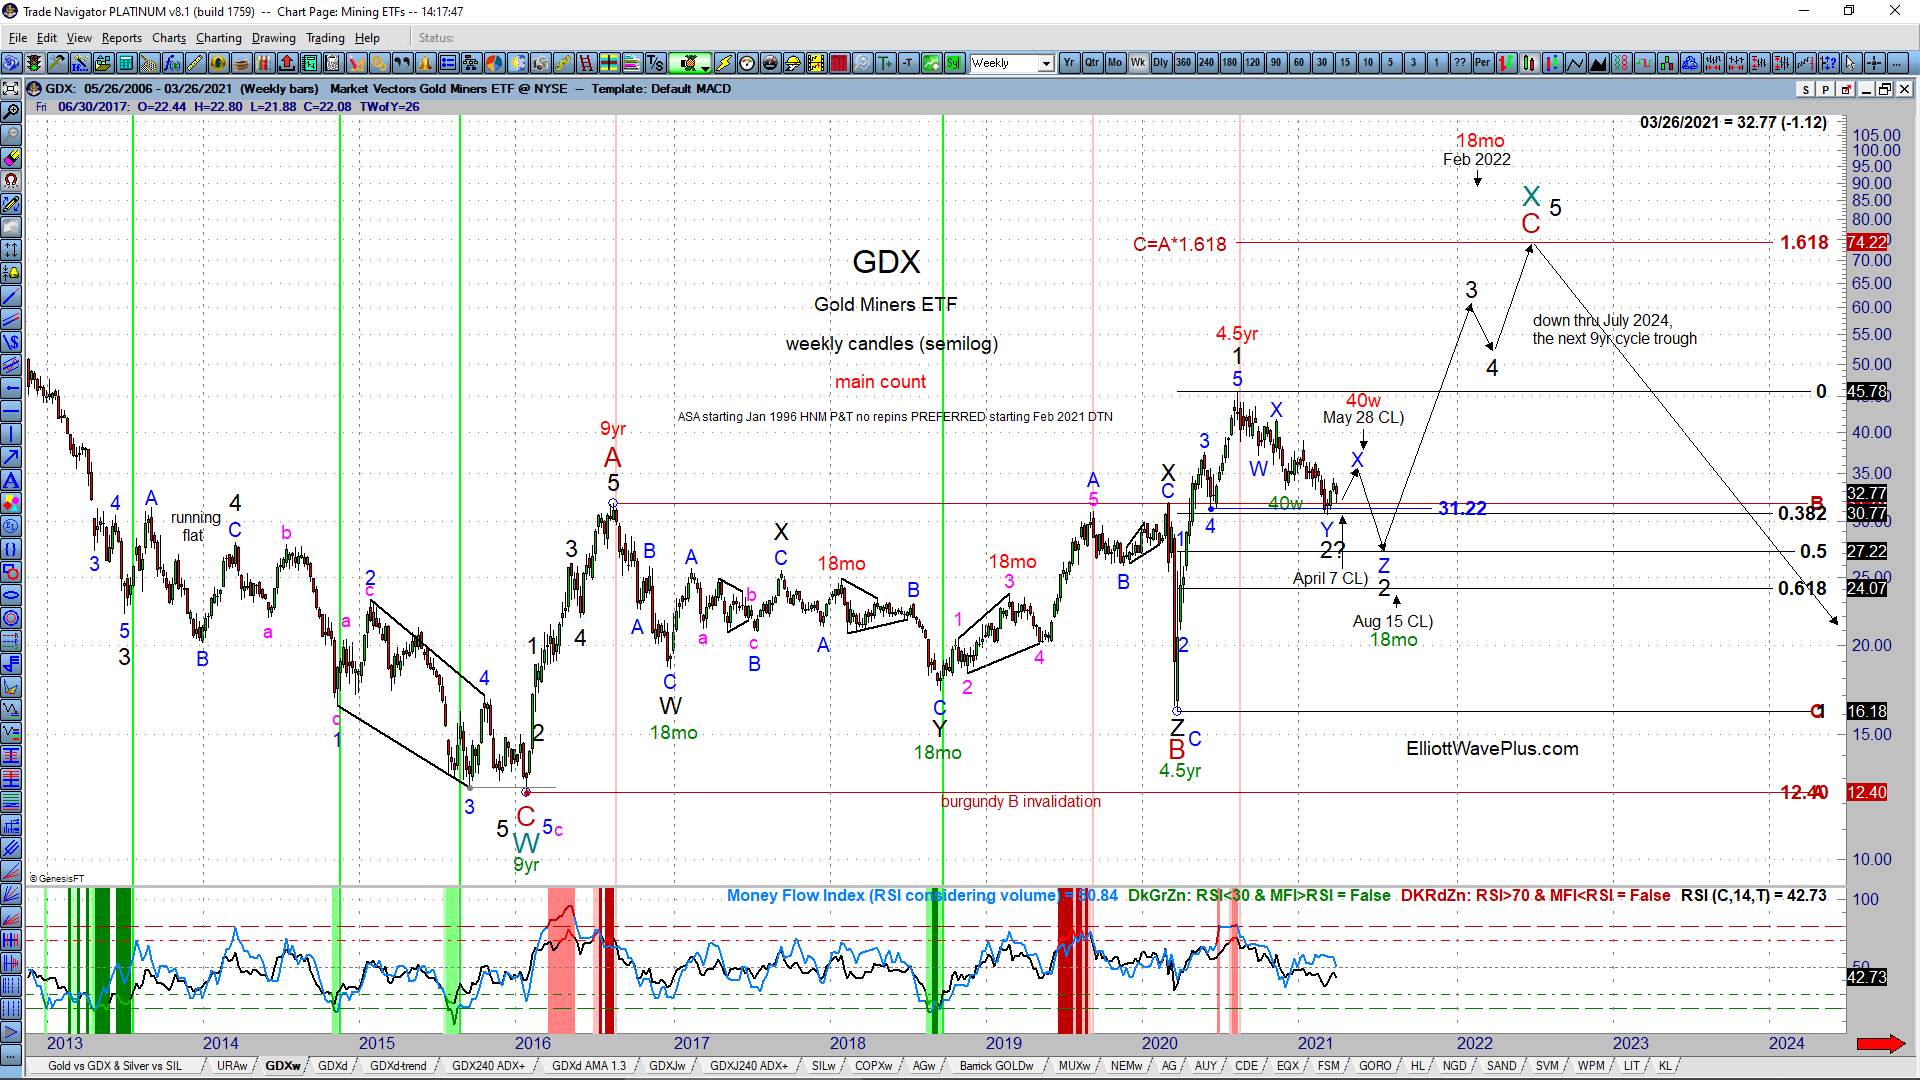
On March 28, 2021, Sid published the above chart of GDX for Elliott Wave Plus Basic Plan, Pro Plan, and Premium Plan subscribers:
Sid’s roadmap had GDX ready to bottom in early April, rally through late May, and then pull back sharply into a large Hurst cycle trough due in mid-August. His late-March 2021 main Elliott wave count predicted that the correction that had been underway in GDX since the early August 2020 high would eventually unfold as a WXYXZ triple zig-zag, likely ending in mid-August 2021, in harmony with the Hurst cycle analysis at the time.
The chart below is a current GDX weekly (through Sept 13, 2021):
GDX weekly
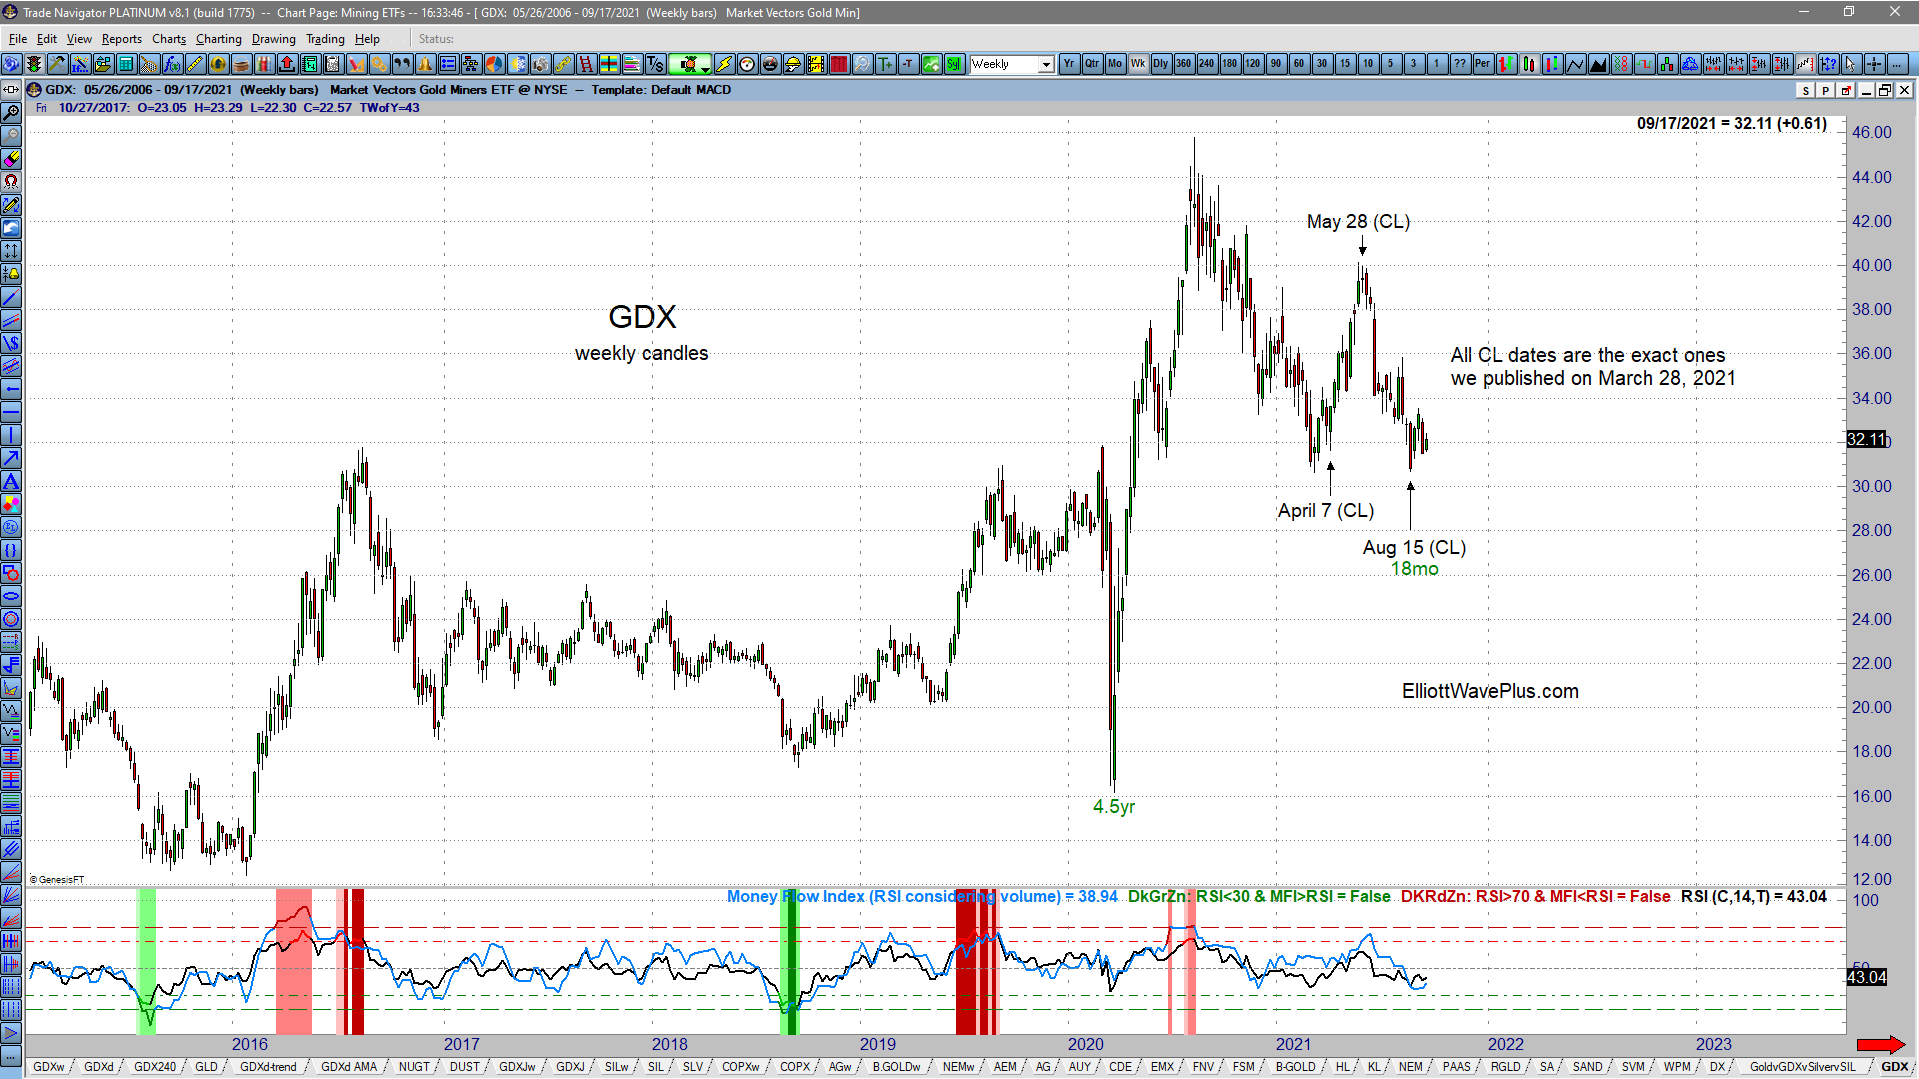
Notice how accurate the Hurst Cycle analysis composite line (CL) turn dates ended up. We have placed the exact dates that were published back in March on this up-to-date chart. You could have simply traded our published dates alone, both to the long and short side over the past five months and done extremely well! Also, as it turns out, the triple zigzag wave count which Sid published back in March appears to have unfolded without revision on both GDX and GDXJ. Both appear likely to have bottomed on August 20. Subscribe to our Basic, Pro, or Premium Plans for twice-per week updated roadmaps on GDX. Subscribers receive both daily and 240-minute charts.
Please note that on the charts, CL stands for the suggested future turn date(s) by the Hurst Cycles/Sentient Trader composite line, which we use extensively in the development of our wave counts and future roadmaps.
While several prominent Elliotticians were publishing extremely bearish articles on GDX as recently as early September, Elliott Wave Plus remained steadfast in it’s long standing wave count and expectation for a large cycle trough to occur in about mid-August. Also, Elliott Wave Plus subscribers have been prepared many months ahead of time for an 18-month cycle peak in the US Dollar Index, which was also due in about mid-August.
– Andrew Norris & Sid Norris
Subscriptions:
We offer a number of subscription levels. Some are mostly about future roadmaps based on a combination of Elliott Wave and Hurst Cycles, and others are based on automated algos. Sid presents his Elliott wave counts, which include integrated Hurst cycle analysis on over one hundred trade-able items for subscribers (Basic Plan & up) every weekend. He sends out updates on the most popular of those items every Wednesday. Trend and Premium Plan subscribers receive trend and algo screenshots nightly, as described in prior blog posts. Sid’s unique approach is well worth considering, especially if you’ve never experienced wave labeling and associated Fibonacci price targets that are derived in harmony with independent Hurst cycle analysis. Here’s more info about subscribing.
Be sure to subscribe at our YouTube channel.
Follow us on Twitter
Follow us on Facebook
(There is risk of loss in all trading. See the full disclaimer at our site.)
Testimonials:
“Hi Sid. Just a quick note. Kudos on the manual cycles. I think it is a really good way to go at this critical juncture, especially on the 80 day and 20 week. Regards.” – Ron
“Sid, Just a quick note from a long-term subscriber to let you know how much I appreciate your work, insight and dedication to excellence. Thank you and regards.” – J.V
Click here for many more testimonials spanning the last ten plus years.[/vc_column_text][/vc_column][/vc_row]