In this document, we’ll explain the notations we place on our charts. You can download a PDF version by clicking here. The notations fall into one of the following categories:
- Elliott Wave, and its associated trendlines and Fibonacci price targets
- Hurst Cycle analysis
- Indication of trend exhaustion
- Indication of MACD divergence
- Commentary regarding sentiment, inter-market correlations, fundamentals, etc.
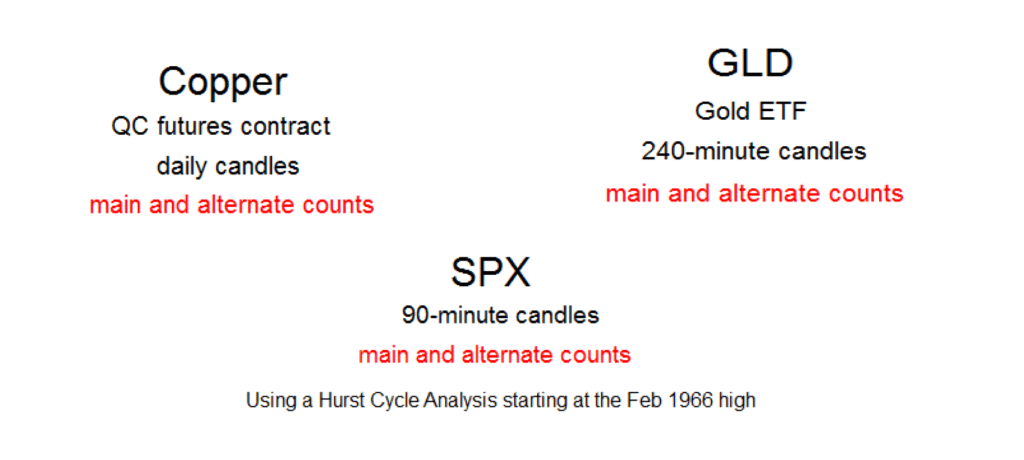
First, let’s look at our chart titles. The chart title will include the trading instrument name/ticker symbol, and the timeframe of the chart being shown (quarterly, monthly, weekly, daily, 240-minute, or 60-minute candles). Here are examples of typical chart titles:
Elliott Wave Labels, Trendlines, and Fibonacci Targets:
Main and/or Alternate Count. Just below the title (see examples above), indication will be made on whether the main Elliott Wave count only is shown, or both the main and alternate counts. If no indication is made, please assume that the chart depiction is the main Elliott Wave count. Important note: We place a question mark (?) after all alternate count labels.
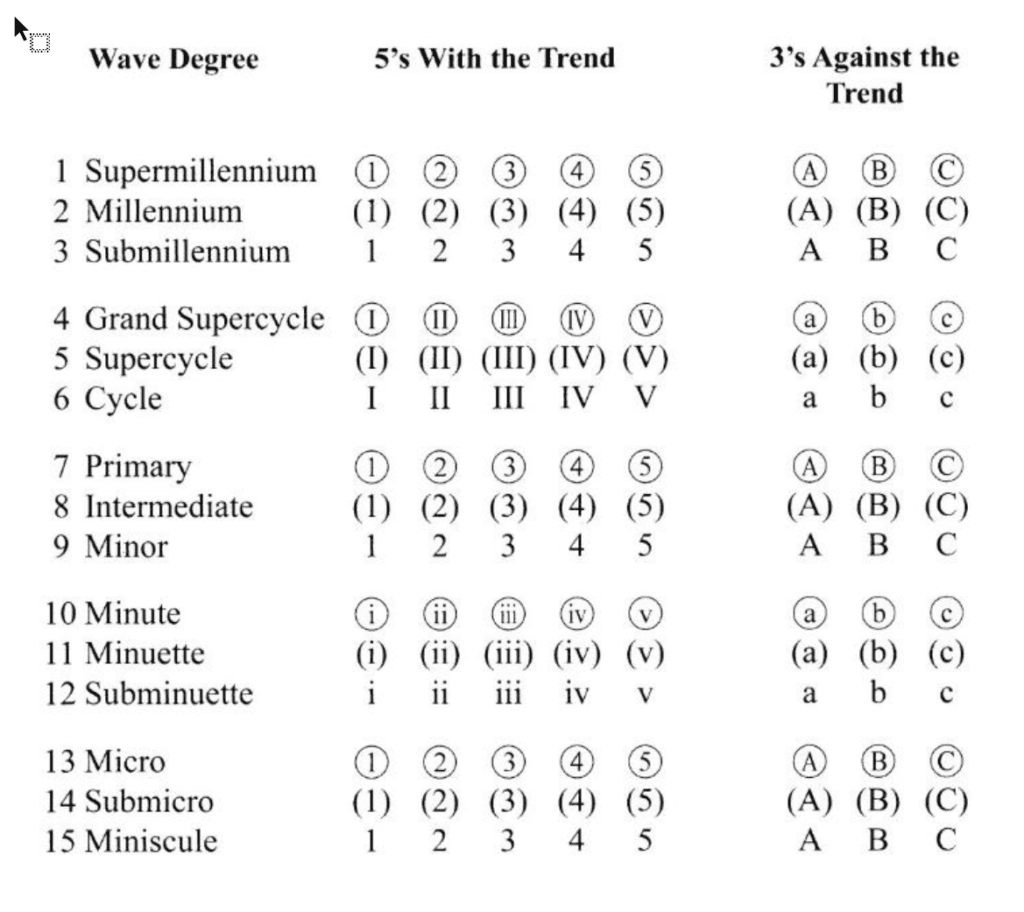
Elliott Wave Labels. For historical reference, below is R.N. Elliott’s original wave labeling system, which consists of upper case letters, lower case letters, Arabic numerals, and Roman numerals, any and all of which may or may not be circled or placed within parentheses:
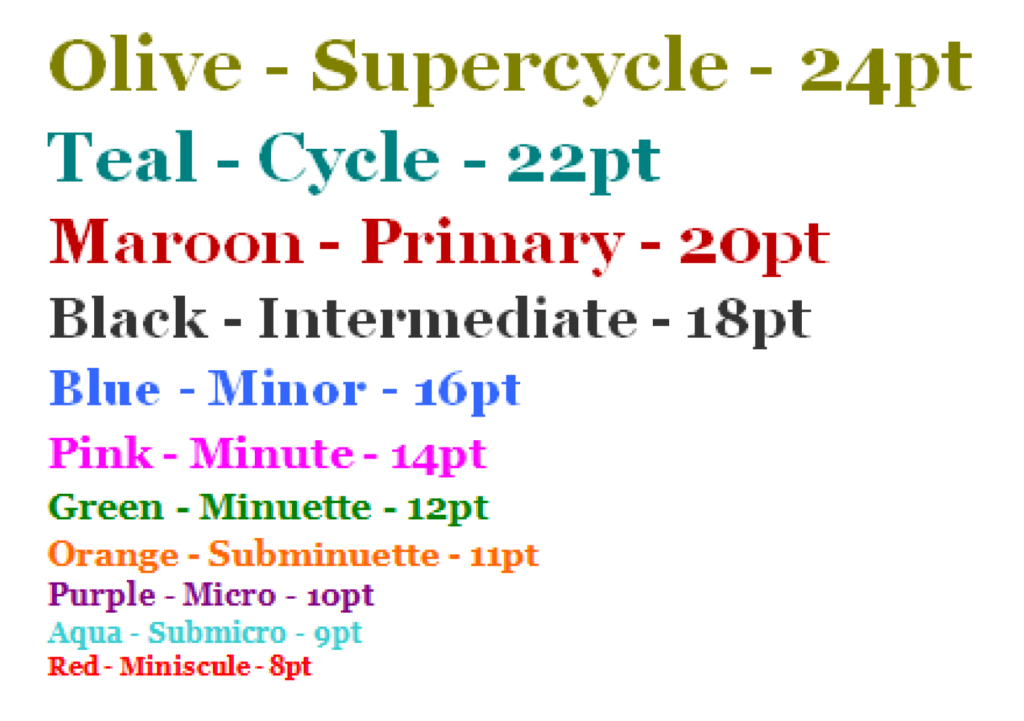
Please note that we do not use the original wave labeling system. We believe that the original labeling system is overly cumbersome and difficult to remember, so we use a different labeling system based on color codes and font sizes. Here is the system we use:
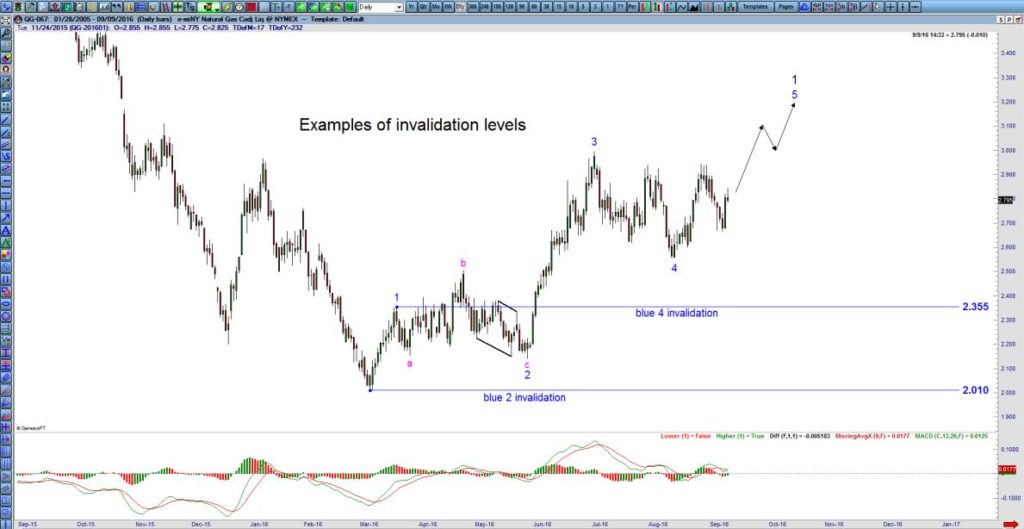
Invalidation. Another important Elliott Wave notation we place on virtually all charts is “invalidation” levels. In Elliot Wave, certain wave counts are rendered “invalid” if price moves beyond a certain level. We are very specific in the notation of our invalidation levels, by also including the “degree of trend” that would be invalidated. For example: “Burgundy 2 invalidation”, or “Blue 4 invalidation”. Here’s how we show invalidation levels:
R.N. Elliott Trendlines. R.N. Elliott devised a trendline system where both “base channels” and “trend channels” can be identified.
Base Channels: In the following example, a stock makes a low, recovers in price, and then tests the original low, but fails to make a new low. This condition allows for a “base channel” to be drawn. Here is an example of a base channel:
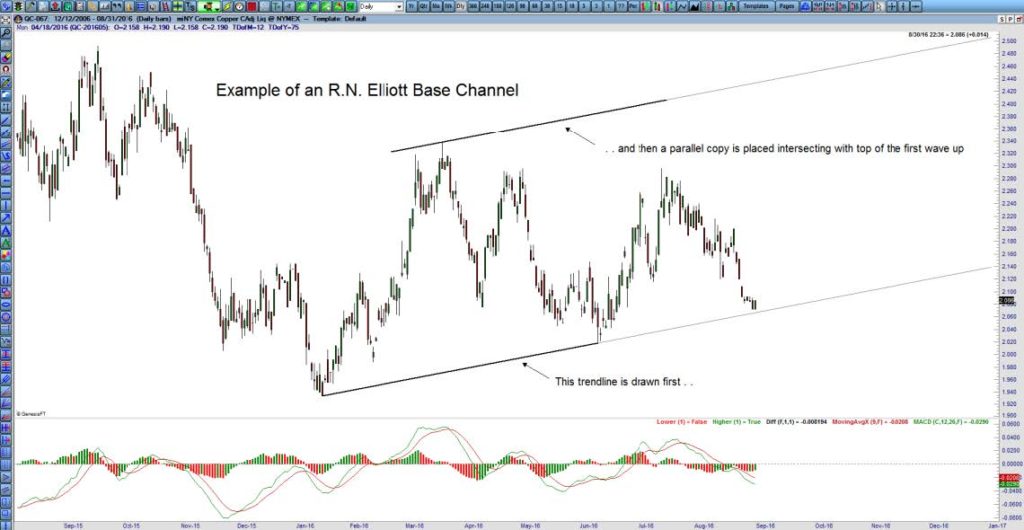
After the base channel is identified, if price breaks through the top of the base channel, a wave 3 is likely underway. If price subsequently moves sideways and lower, and breaks though the bottom of the base channel, the sideways movement was likely corrective, and a reversal of trend to the upside is unlikely to be underway. In the example above, price has not broken out of the base channel in either direction yet.
Trend Channels. Let’s say a stock makes a low, recovers in price, and then tests the original low, but fails to make a new low, and then rallies strongly, breaking out of the base channel to the upside. A new trend to the upside is underway, likely in the form of a 3rd wave. Once wave 3 is finished, we can connect the extremes of waves 1 and 3, and place a parallel copy at the extreme of wave 2. This trendline is likely to provide support for the end of wave 4. Here is an example of a trend channel:
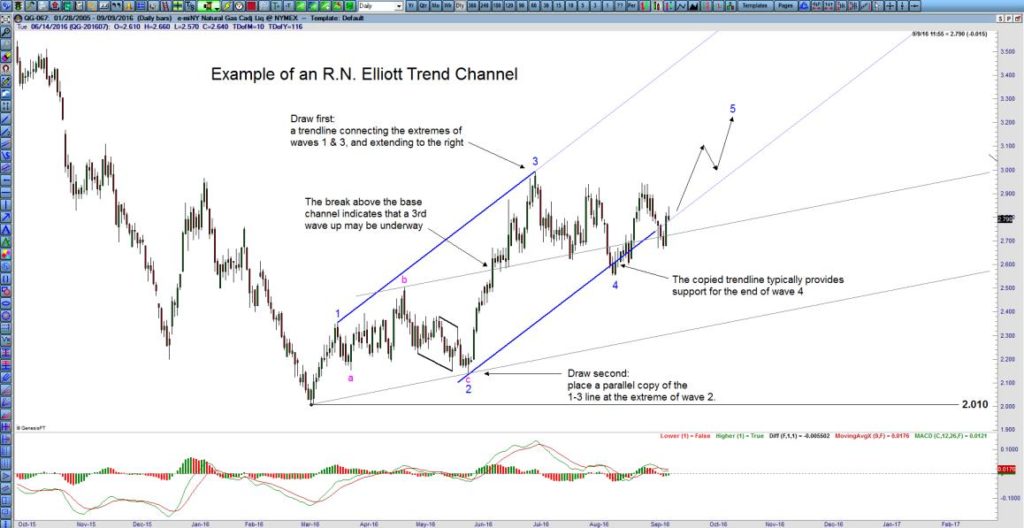
By the way, we typically color code our trend channels. In the above example, we were looking for channel support for the end of blue wave 4, so we used blue trendlines.
Fibonacci price targets based on relationships with prior labeled waves.
Once Elliott wave labels are applied to any chart, price targets based on known typical Fibonacci relationships between waves can be established. For a more complete discussion of Fibonacci price targets within specific wave counts, as well as the rules and guidelines of the wave principle, check out our “Sid’s Elliott Wave 101” video. It is highly recommended ALL Fibonacci targets on ALL timeframes be applied using semi log charts and drawing tools that utilize semi log math.
Here are some examples of setting Fibonacci price targets.
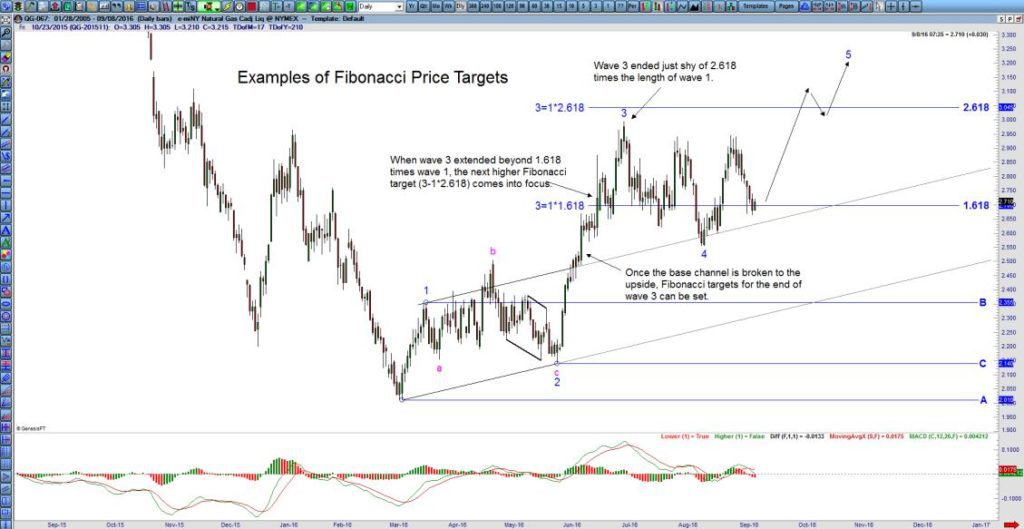
Fibonacci Extensions: Once an impulsive wave count is established (12345), there are known typical Fibonacci price targets for subsequent waves, if the wave count is correct. For instance, the most typical target for a 3rd wave is where wave 3 “extends” to very near 1.618 times the length that wave 1 was. The second most typical length of a 3rd wave is where wave 3 is 2.618 times the length of wave 1. Once price breaks out of a base channel, and the wave count is projecting that a 3rd wave is underway, we can set targets for the end of the 3rd wave. The following example shows how we set and label Fibonacci extension price targets, in this example for the end of wave 3. Notice the blue color coding of the Fibonacci tool and supplementary labeling (3=1*1.618 and 3=1*2.618) to match the degree of the wave 3 target (blue):
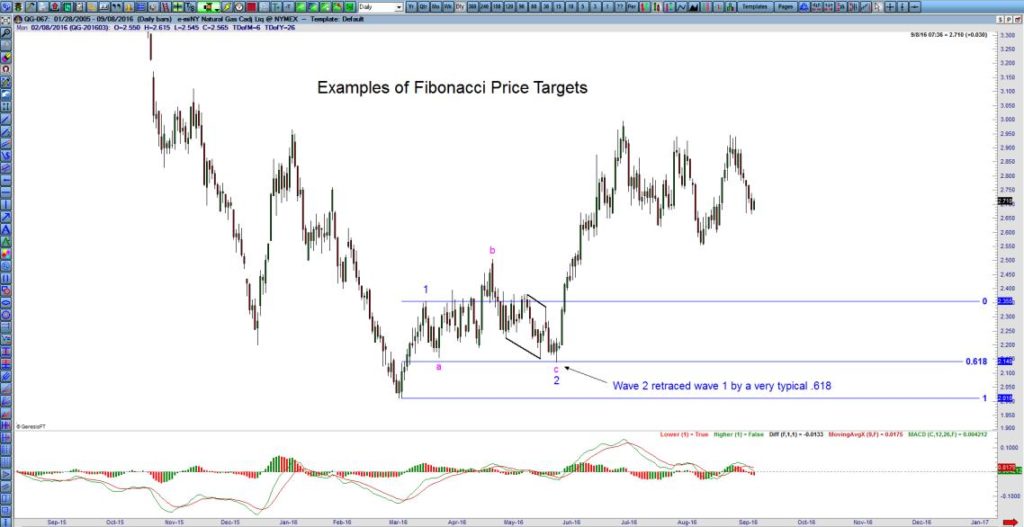
Fibonacci Retracements: Below is another example of a setting a Fibonacci target, this time of a Fibonacci “retracement” target. In this example, the wave count is expecting that five waves to the upside may eventually develop. After placement of the wave 1 label, the expectation was for wave 2 to partially retrace wave 1. It is common for wave 2’s retrace wave 1’s by a factor of .618 (the golden mean). In this example, wave 2 (blue) retraced wave 1 by exactly .618 :
Fibonacci Expansions: (not pictured). An additional method for setting a Fibonacci targets is to measure the first leg of a move, consider that distance a unit of “one”, and then multiply that distance by .382, .628, 1, or 1.618, and then ADD that to the TOP of the initial move (if the initial move was to the upside), or to the bottom of the initial move (if it was to the downside). This is called setting a Fibonacci expansion target. For example, if the initial move is labeled wave A of an incomplete correction, expect the eventual wave C of the correction to be a .382 or .618 expansion of A. Or, if the initial move is labeled wave 1, expect the wave 3 to be a 1.618 expansion of wave 1.
Upon occasion, a cluster of Fibonacci targets will present itself. When that occurs, we may delineate the price target zone with a grey oval (not pictured).
Hurst Cycle Analysis:
While many of our clients are fairly familiar with Elliott Wave, few are well versed in the application of Hurst cycle analysis to the markets. This next section therefore offers introductory detail to Hurst’s system, as well as an explanation of the Hurst-oriented notations we place on our charts.
The following paragraphs were borrowed from the www.SentientTrader.com website:
“JM Hurst was an American engineer who, in the 1960s and 70s, was the first researcher to use the power of the modern computer to investigate cycles in the financial markets. JM Hurst is widely recognized today as the ‘father’ of modern cyclic analysis. His ideas are generally accepted as the optimal method for trading with cycles and many traders worldwide profit from trading the Hurst Cycle.
Hurst published a book in the early 1970′s called “The Profit Magic of Stock Transaction Timing”, and then followed that with the publication of a workshop-style course, called the Cyclitec Cycles Course, also known as “JM Hurst’s Cycles Course”.
In these two works he presented the Cyclic Theory for which he has become famous, and he set out his methodologies for trading with cycles. The Profit Magic book proposed a technique for applying his Cyclic Theory, but it was in his later Cycles Course that Hurst presented his truly ground-breaking work for trading the Hurst Cycle.”
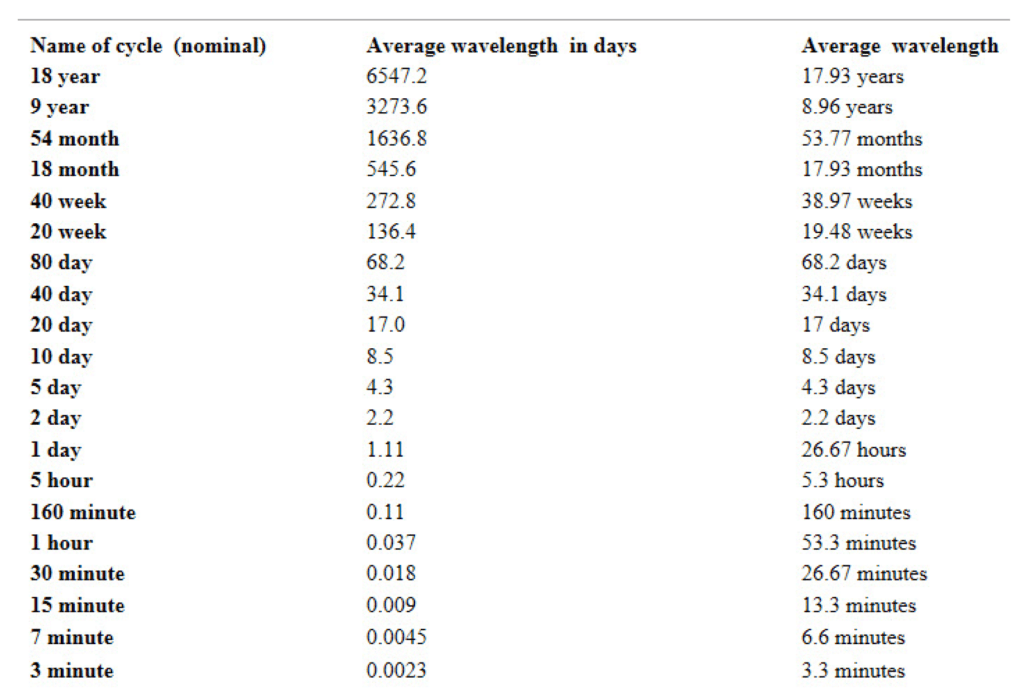
Hurst developed what he referred to as a “Harmonic Nominal model”. Once again, the following paragraph and table were borrowed from our friends at SentientTrader.com:
“Hurst studied the price movement of 1,000s of instruments, using newly available computers. He discovered that rather than cycles being a random collection of cycle lengths, there are prominent wavelengths which are related by a harmonic ratio. These prominent wavelengths recurred again and again across all the instruments he studied. He defined these wavelengths in a Nominal Model (nominal meaning the name of the cycle).”
These cycles overlap and combine to influence price movement. Each cycle can and will, in reality, vary a bit from the average historical length of that cycle, but as a general observation, if there are more cycles currently pushing to the upside than the downside, price tends to go up, and vice versa.
Hurst’s model explains why the markets occasionally trend very strongly. At certain junctures, the great majority of cycles align in their directional pressure. The result is a fast trending market. Hurst also observed that if price is strongly moving to the downside (for instance), a “synchronized” trough of numerous cycles is likely. Synchronized troughs create wonderful buying opportunities.
Fortunately, there is software available today to perform Hurst cycle analysis on any chartable item fairly quickly. That software is called “Sentient Trader”. We have grown to use Sentient Trader / Hurst cycle analysis extensively, as it provides an ideal “check and balance” when used in combination with the potentially subjective Elliott Wave theory. For more information about Hurst cycle analysis and Sentient Trader software, check out www.SentientTrader.com. Additionally, see our educational video: “Introduction to How I Combine Elliott Wave and Hurst Cycle Analysis”
Below are several screenshots from Sentient Trader software so you’ll see how we use it, and what our own Hurst-oriented chart notations mean. First, let’s start with the Dow Jones Industrial Average from 1928 through 2016, including a default (unaltered) JM Hurst “nominal model” analysis of that entire date range.
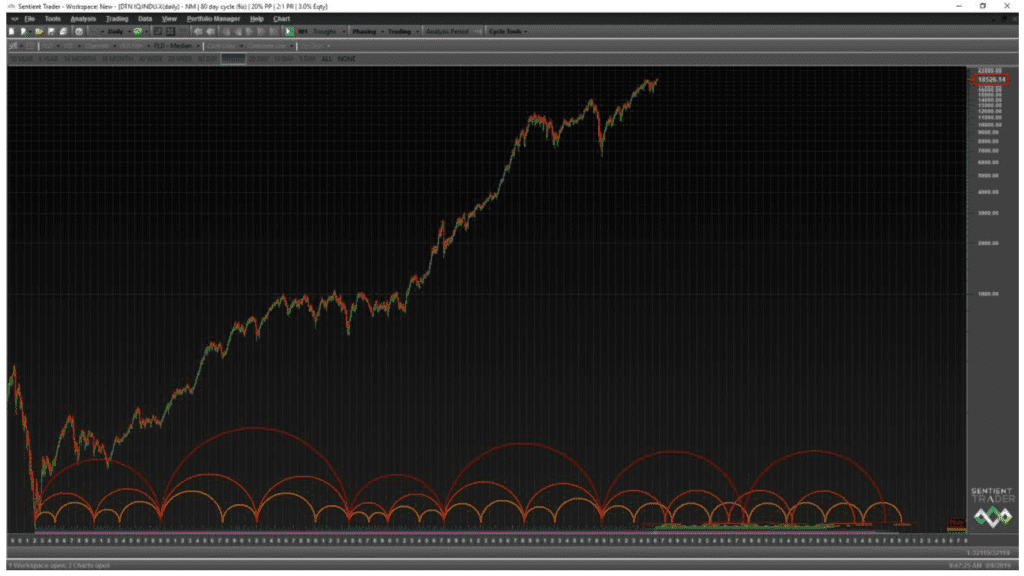
Notice the “phasing” shown across the bottom. These multiple “arcs” represent Hurst cycles of different lengths. The longest cycle that Sentient Trader software designates is the 18-year cycle. Those are the largest arcs, shown in red. Within each 18-yr cycle are two 9-year cycles (shown in orange), and within each 9-year cycle there are two 4.5-year cycles, (shown in mellow yellow). Notice that some variation of cycle lengths is allowed for. For instance, the 18-year cycle isn’t always exactly 18 years in length.
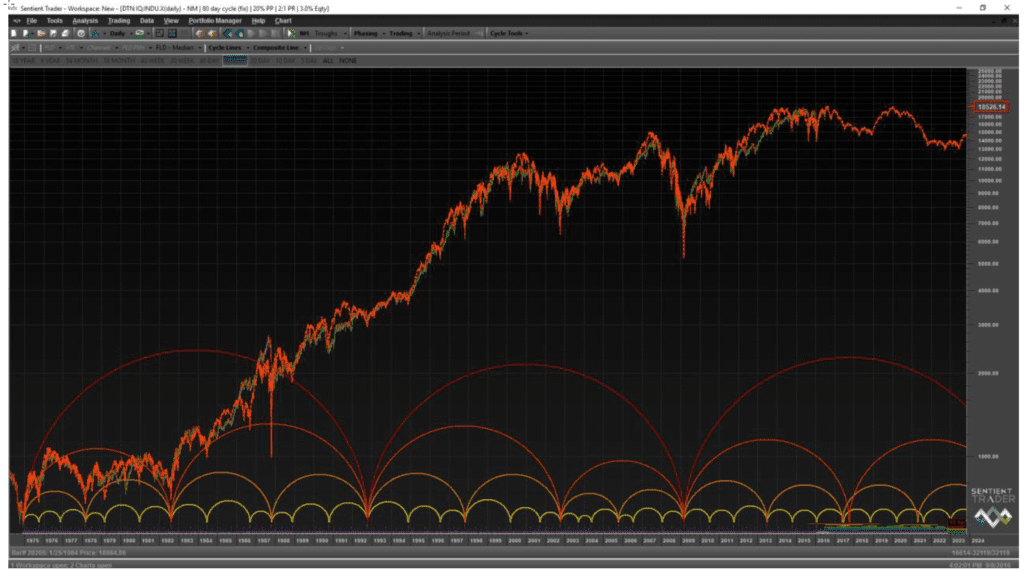
The next screenshot is a closer-up view of the Hurst cycle analysis of the Dow Jones Industrial Average starting at the 1929 high, but showing only the timeline from trough 1974 though about 2023. By zooming in further, more phasing detail is revealed. We can see that within each 4.5-year cycle (shown in mellow yellow), there are three 18-month cycles, shown in bright yellow. Also included in this screenshot is the Sentient Trader composite line”, which is the jagged orange line that generally follows price history, and then projects cyclical movement into the future, under the assumption that the phasing of the cycles associated with the current analysis will continue into the future.
The Sentient Trader composite line takes all of the defined cycles into consideration and attempts to predict future directional price movement. The word” directional” is important here, as the composite line has proven more useful when utilized to project future market direction, rather than future price target levels. (For projected future price levels, we generally prefer Elliott Wave and its associated Fibonacci price targets.)
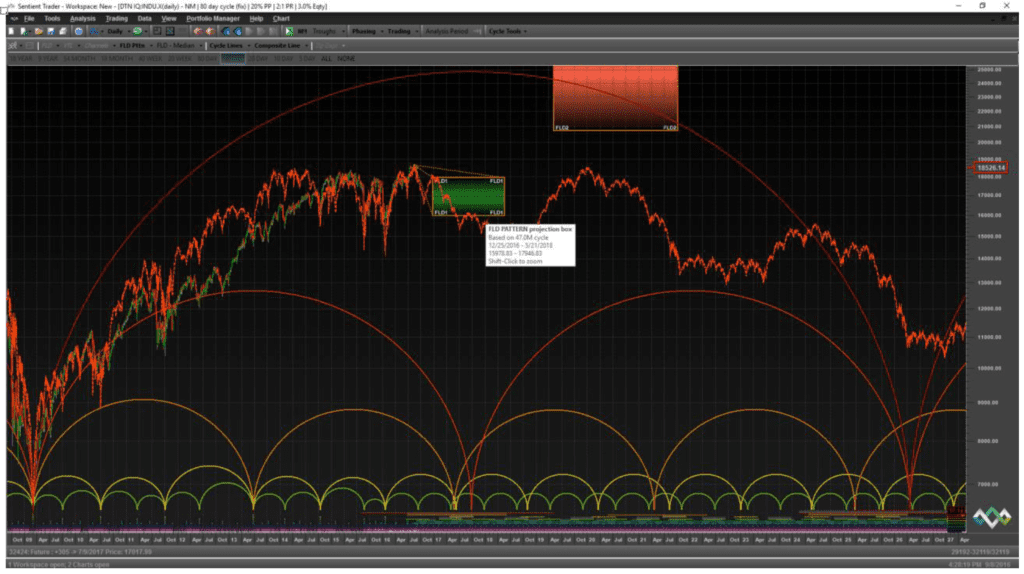
Finally, the next screenshot shows the same analysis, zoomed further in, showing price data from 2008 to 2016, and forward projections (via the composite line) through the year 2027. Notice that there are now two 40-week cycles (shown by the green arcs along the bottom) within each 18-month cycle (shown in bright yellow). By hovering the mouse over the next projected 4.5-yr cycle trough window (the green box), a white information box pops up (in the center of the screenshot), which lists the date range of the projected 4.5-year cycle trough “window”. We could have turned on the windows for any and all of the other cycles as well, and could have zoomed in even further, showing projected directional price movement (via the composite line) within the shorter cycles, for instance the 20-day, 40-day, 80-day, 20-week, 40-week, etc.
As you can see, Hurst analysis is quite different from Elliott Wave, and that’s why we like it very much as a “check and balance” to be utilized alongside the wave principle.
There are many times when the Hurst analysis comes in very handy when used in conjunction with Elliott. For instance, in Elliott Wave, after a potentially complete 5-wave up structure, the wave principle might suggest that a .618 retracement of the 5-wave move would be next, or possibly a corrective drop back to the extreme of the prior 4th wave. But what if the expected retracement happens very quickly? Has enough time elapsed for the next 5-wave move to the upside to be imminent? Or, will the correction “extend”, and eat up more time? What if price continues unabated to the upside? Is the five-wave upside move incomplete? To solve these puzzles, we use Hurst to assist with the critical timing element.
Examples of Hurst Cycle Analysis Notations on our Charts:
Based on the recent timing between troughs, there are date “windows” for the expected Hurst cycle troughs (bottoms) and crests (tops). We notate projected trough windows with green lines and date ranges under the candles, and we notate projected crest windows in red, over the candles:
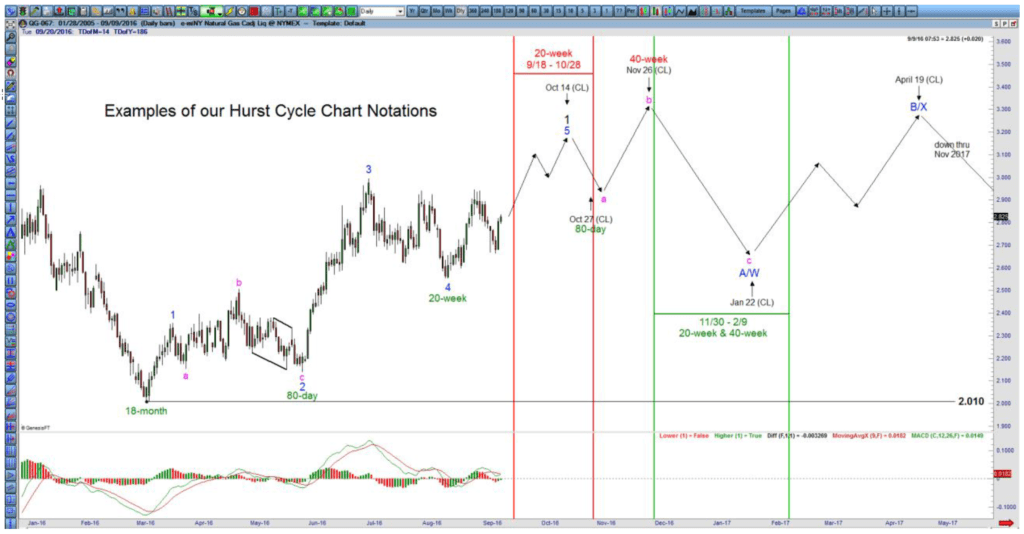
Also, we examine the Sentient Trader “composite line” very carefully and show specific projected dates for tops and bottoms with smaller-font black-letter notations. For example, inside the red 20-week cycle cresting window above, there is a notation: “Oct 14 (CL)”. The (CL) stands for “composite line”. In this example, that date notation is accompanied by a down arrow. This means that the composite line is currently projecting a top on October 14, to be followed by downward movement, in this example initially through October 27, where the next 80-day cycle trough is expected.
Important note regarding our composite line notations: Hurst cycle analysis often provides a somewhat different forecast for future directional price movement depending on the starting date used for the analysis. Over the years, and after much trial and error, we’ve learned how to choose among potential starting dates, based on how well the cycle analysis has been working in recent weeks and months. We obviously prefer to utilize starting dates that have been providing more accurate forecasts on intraday (240-minute and 60-minute) charts recently. However, upon occasion, there may be more than one starting date worthy of consideration in our opinion. On those occasions, we may add a starting date to the composite line projected-turn-date notations on our charts. For instance, instead of just “Oct 14 (CL)”, we might notate: “Oct 14 (2011 CL)”, as well as “Oct 21 (2007 CL)”. In that example, a Sentient Trader analysis starting in 2011 would be projecting a turn on October 14, whereas a Sentient Trader analysis starting in 2007 would be projecting the turn on October 22.
It is also especially important to understand that Hurst cycle analysis constantly “morphs” based on ongoing price action. It labels a specific cycle peak or trough only after price has moved across a displaced moving average associated with that specific cycle. This is why the projected date windows, and composite line suggested top and bottom dates can and often do “adjust” on a daily basis, depending on whether price is trending or consolidating. Usually, these adjustments are slight, but occasionally, a larger adjustment is necessary to accommodate unexpectedly large moves. So just like Elliott Wave, Hurst analysis can “self-correct” by making adjustments as time (and price) moves along. It is important to note that the two systems (Elliott & Hurst) do not use the same levels as correction or adjustment points. This is why the combination of the two dissimilar methodologies is more powerful than either system when used alone.
No system of analysis and subsequent projection for price movement is correct all the time. That’s why we combine dissimilar methodologies like Elliott and Hurst. When those two systems agree as to the expected future direction of the market, confidence is increased, and accuracy is improved in our experience.
Indication of MACD divergence
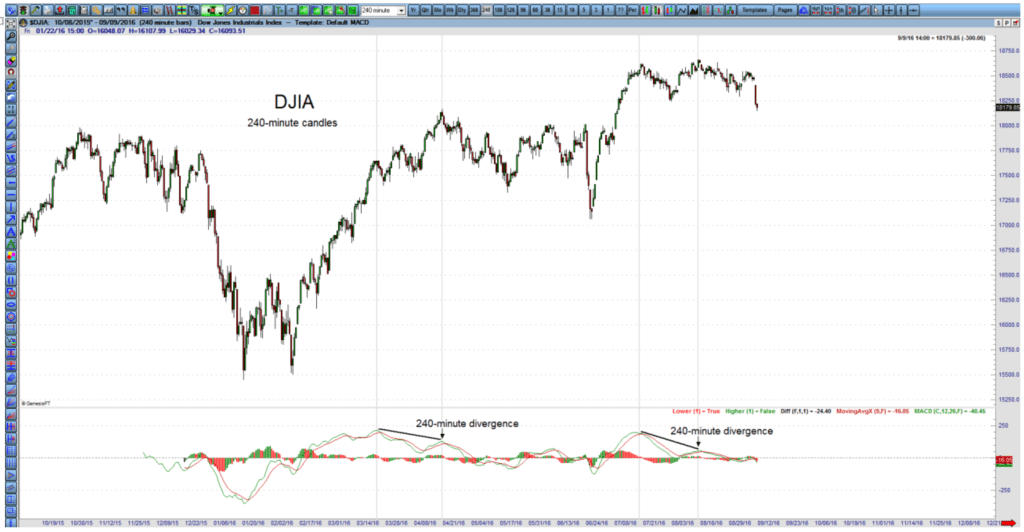
The MACD indicator is one of the most valuable standard indicators available on all trading platforms. “Divergence” is when price is making a new extreme, but a momentum indicator (like MACD) is not. Divergence between price and the indicator can indicate an imminent trend change. Also, the longer the timeframe of chart, the more powerful the potential trend change due to the divergence. For instance, you can wait a long time for MACD divergence to develop on a weekly or monthly chart, but the size of the coming trend charge (upon fully formed divergence) is likely to be substantial.
Careful monitoring of the MACD indicator on multiple chart timeframes can provide important clues as to future market direction because multiple divergences at smaller timeframes generally lead to a larger, more powerful single divergence at larger timeframes. This is one of the reasons we provide analysis of the same tradeable item using multiple timeframes, each showing the MACD indicator. As a general rule, we like to see MACD divergence on chart timeframes of 180-minutes-per-candle or longer before we notate the divergence on our charts.
Below is an example of the way we typically notate MACD divergence:
For more details on how we utilize the MACD indicator, check out our video: “Early Detection of Trend Changes Using a Combination of MACD, and Japanese Candlesticks”.
Commentary Regarding Sentiment, Inter-Market correlations, Fundamentals, etc.
Finally, we may place a sentence or two on our charts, explaining our view of the current situation. Here are a few examples of comments you might see from us:
Regarding Sentiment:
- “Large commercial traders are heavily short, and retail traders are heavily long. This sentiment condition is bearish.”
- “Large commercial traders are heavily long, and retail traders are heavily short. This sentiment condition is bullish.”
- “Large Commercials and retail traders are non-committal at this time. No short or long squeeze is imminent.”
- “The number of puts being held currently far outweighs the number of calls. A P/C-ratio buy signal is imminent.”
Regarding Inter-Market Correlations:
- “Commodities are unlikely to rally strongly until the US Dollar tops. The projected topping date for the US$ is “X/X/XX.”
- “The composite line on the SPX is not in agreement with the composite line on the DJIA after X date. Confidence will be low on what will happen from that date until the two agree”.
Regarding Fundamentals:
- “The average company in the {X Stocks Index} has been losing money since March. The current rise is therefore unsustainable from a fundamental viewpoint.
- “Big economic announcements are due on {X} date: retail sales, payroll, and PPI. Expect volatility (running of stops).”
Regarding Elliott Wave:
- “Typical retracement target level: the extreme of wave 4 at one lesser degree”
- “Because wave 2 was a flat, based on the guideline of alternation, we expected wave 4 to be a zigzag, a triangle, or a WXY combo. Now that the initial corrective wave was a “three”, a zigzag is out of the running. We’re down to a triangle or a WXY combo.”
Regarding Hurst Cycles:
- “The composite line is currently suggesting the alternate count”
- “This roadmap is based on a Sentient Trader (Hurst cycle) analysis starting at the 1966 high”, (or whatever date).
Putting it all Together
By combining multiple dissimilar methodologies of technical analysis, we believe that the effectiveness of our forecasting service for traders, investors, and money managers around the globe has been greatly enhanced. The testimonials we receive from our clients say it all.