How One Subscriber, an Experienced Trader, Utilizes Our Analysis in His Trading
The following is a document and associated screenshot provided to us by a longtime subscriber, and experienced trader.
He describes exactly how he uses our work in support of his trading. Enjoy!
Elliott Wave Plus
The following trading education document and accompanying chart were provided to us by longtime Premium Plan subscriber “William” yesterday. William is a highly experienced and learned trader, and a multi-decade student of the methods of Larry Williams, Tom DeMark, and others.
“Hi Sid,
This set of notes and the attached /CL (Crude Oil) chart explains the key points I like to use to find the best entry for trades. Your combined Elliott Wave and Hurst Cycles “Road Maps” point the way! It sometimes takes a little driving though before the all-important turn at the “fork” occurs. I have found that using the methods described in this document allows me to take maximum advantage of your work.
The techniques described here were garnered from many different sources, but primarily from the teachings of Larry Williams. Just about everything listed/highlighted here can be found in Larry’s books. These indicators and associated interpretations of them work great in harmony with your analysis!
The attached chart is a timely example, as the price of Crude Oil just turned. I hope the techniques shown here might help your subscribers to better trade your work! Importantly, it is best to limit focus to one or two, (maybe three max) tradeable items, and complete a thorough evaluation of market prices and structure as shown in the /CL chart example. Otherwise they might miss the turns!
Of course, your daily AMA Algo and Trend Charts point the way also. I utilize those two chart types daily to help focus on the best markets to trade at the moment. In other words, your MOMENTUM ALGO and TREND FOLLOWING TEMPLATE charts are provide an excellent market screening tool.
The use of the techniques shown on the accompanying chart might also assist in screening out potentially bad momentum algo signals, although your algos continue to perform quite well over time.
I like to use use a few simple indicators:
- DMI – (DMI+/DMI- and ADX) provides trend direction and strength, as well as momentum.
- ATR– Average True Range gives the trader a great understanding of when a turn is likely to come (i.e. at the greatest and least values for the ATR. Off course the change is only visible in the rear-view mirror. However, using long-term chart (e.g. one year) will give the trader a great idea of what levels of ATR have provided for market swings in the past. The range expansion occurs at the ATR low or high point. Important note: The range expansion does not always occur opposite the trend.
- Simple Moving Average – I use an 18 period SMA. It helps to identify trend but also provides great entry price when the clear entry time becomes obvious. Rule: Sell Entry below the SMA or Buy Entry above the SMA when the market is “set-up” for a move in that respective direction.
- Linear Regression Trend Line (LRTL)- The LRTL gives me a clear picture of Trend over any chart period I choose and provides Trend Direction with a quick glance.
I utilize Larry Williams’ “Market Structure” as described in Chapter 1 of his book “Long-Term Secrets to Short-Term Trading”:
I keep track of Market Highs (H), Market Lows (L), Intermediate Term Highs (ITH) and Intermediate Lows (ITL) and Long Term highs (LTH) and Lows (LTL). I perform this simple task every day. This exercise fulfills the requirement for viewing price action of the markets in search of targeted entry. The choice of which markets are currently providing setups to evaluate comes from the Sid Norris EW+FibTargets+Cycles “roadmaps” I receive as a Premium Plan subscriber. The ITL and ITH provide great entry price points, but patience is required! Price will find these levels and move past them or use these price levels as support or resistance. More on that later.
I Make Notes on the Charts
I’ve found that making notes on the chart is an important aspect of observing markets, especially when starting out as a trader. The accompanying chart exemplifies how I do it. I make notes on charts in each indicator window and then save a screenshot of the chart each day. The notes are generally made each day at the close. It is important to observe each indicator and clearly and concisely make notes on what the indicator has done that day in relationship to the past few days. Also, notes should be included about the relationship between the indicators at important junctures.
Interpreting the Indicators
Here’s how I use the DMI indicator and its components. This Indicator provides a lot of information!
The Directional Movement Indicator provides the prevailing trend direction. This is indicated when the DMI (+/-) is the upper-most line. Be careful. This line can and does whipsaw under certain conditions in a range bound market. The ADX (Average Directional Index) is used to give relevance to the DMI lines. As a trend develops, one of the two DMI lines establishes itself by rising above the opposite line (the /CL chart DMI- crosses above DMI+), while the ADX line moves (on average) in the same direction as the dominant DMI line, AND price. The greater the value for the ADX, the stronger the trend. However, and this is very important, trading in the direction of a DMI cross is very risky unless the market is clearly set-up for a move in the direction of the cross. In the /CL chart, the sell entry at the DMI cross is a valid and “safe” trade because of a supporting information, not the least of which was the expectation from the Sid Norris Roadmap that the next swing in the /CL market was going to be to the downside.
Putting it all Together for a Recent Short trade in Crude Oil (CL Futures Contract)
Now back to the attached /CL chart, we can see the following evidence for a coming market swing:
- Sid Norris Cycles Analysis indicates a swing in the Market is coming. Exact timing is not precisely known, but that fact that a swing IS coming is profound “insider” information on what is most likely to happen next.
- Sid’s Elliott Wave Count tells us when a particular wave is complete or is likely to be complete within a few days following Sunday Webinar. (The Sunday Webinars are included in the Pro and Premium Plans). This provides the expectation of a relatively imminent changes in the market swing direction. This provides notice of a coming trade “set-up” in the market.
- Elliott Wave Plus’s Sentiment Condition Charts (included daily in the Premium Plan) also provides insights into expected market swings in support of the Cycles and wave count information. So, we have three critical bits of data informing us of a coming market swing!
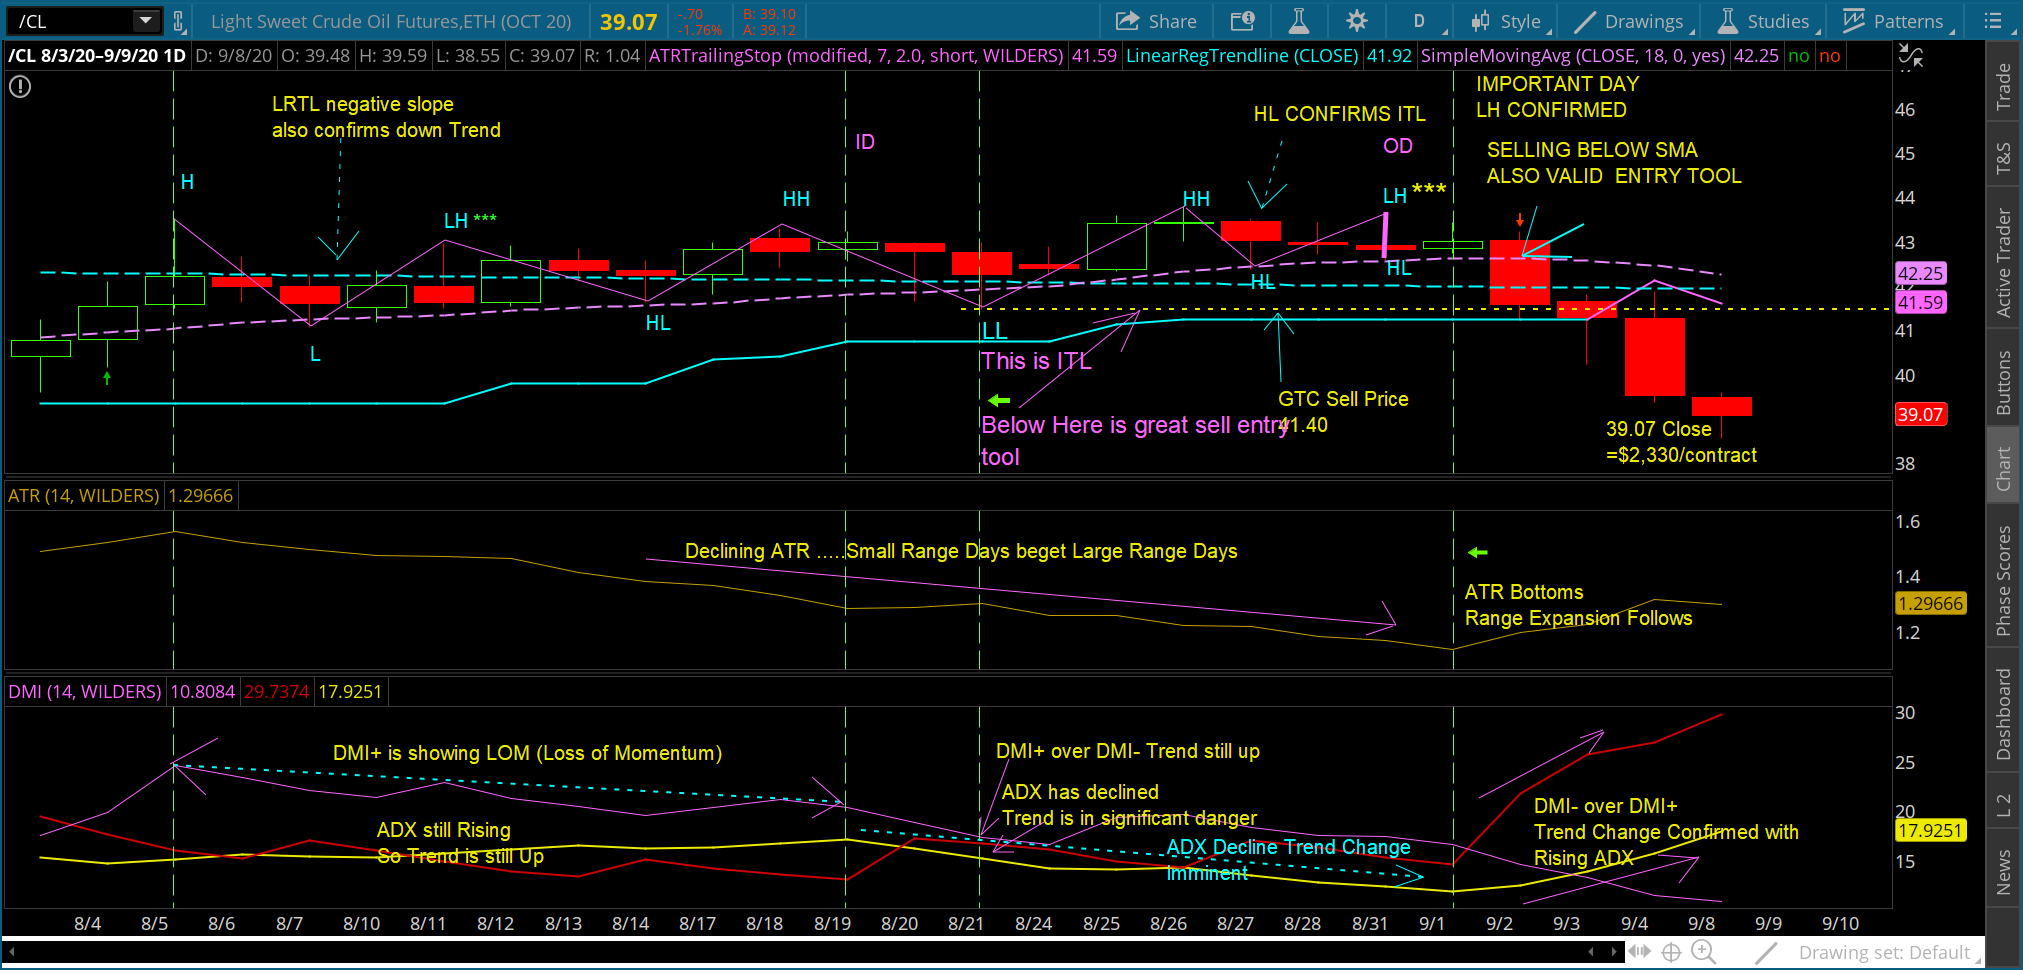
By establishing Larry Williams “Market Structure” system as to highs and lows, etc., as shown on the /CL chart, the trader will clearly see a change in market structure prior to the price swing. In the case of /CL, traders are in search of a lower high (LH) day which confirms weakness in the price direction. Be aware, there are false signals of lower highs. This occurred in crude oil on August 11, 2020. A lower high was confirmed on August 12. but we knew this was a false signal because the DMI lines were far apart. Lower highs provide valuable information at a time when a market swing is expected, and the DMI lines are close enough to be able to cross very soon. If this case, after a LH occurred on Aug 31, and with the DMI + & – lines close together. a prudent GTC sell entry order was placed below the ATR Trailing Stop line. VERY IMPORTANT: If you are in a long trade and a Lower High day appears, tighten your stops! As can be seen from the /CL chart, the day after the lower high (LH) of August 31 was confirmed, the next day, price did drop!
The formation of an Intermediate Term Low (ITL)- On the /CL Chart: an ITL formed on August 21. We only know this is an ITL and not a simple low, because of the formation of a higher low on August 27. The definition of an Intermediate Term Low is a low with higher simple lows on either side. Personally, I use the ITL as an entry when I have high confidence that the market will swing, in this case to the downside. In this case I enter a GTC sell order a few ticks below the ITL. I do this in case I am not at the computer trading the day the of the price move. I also place the entry price a few ticks below the ITL because price can and does utilize ITLs as support. Price can and does fall to the ITL or one or two ticks below and then shoots back up in the direction of the trend! Certainly, price returning above the LRTL and/or the SMA indicates price has resumed the trend. For this reason, I use the LRTL or the 18-SMA as my initial stop loss for my GTC trade below the ITL. I set my stop a few ticks above these trend lines. For my target, I initially use 50% of the distance between the LTL and the LTH of the price move immediately preceding the current market swing. This value is based simply on the “Reversion to the Mean” concept of market price movements. It is wide enough so that I will not miss the huge price expansion days following the market swing.
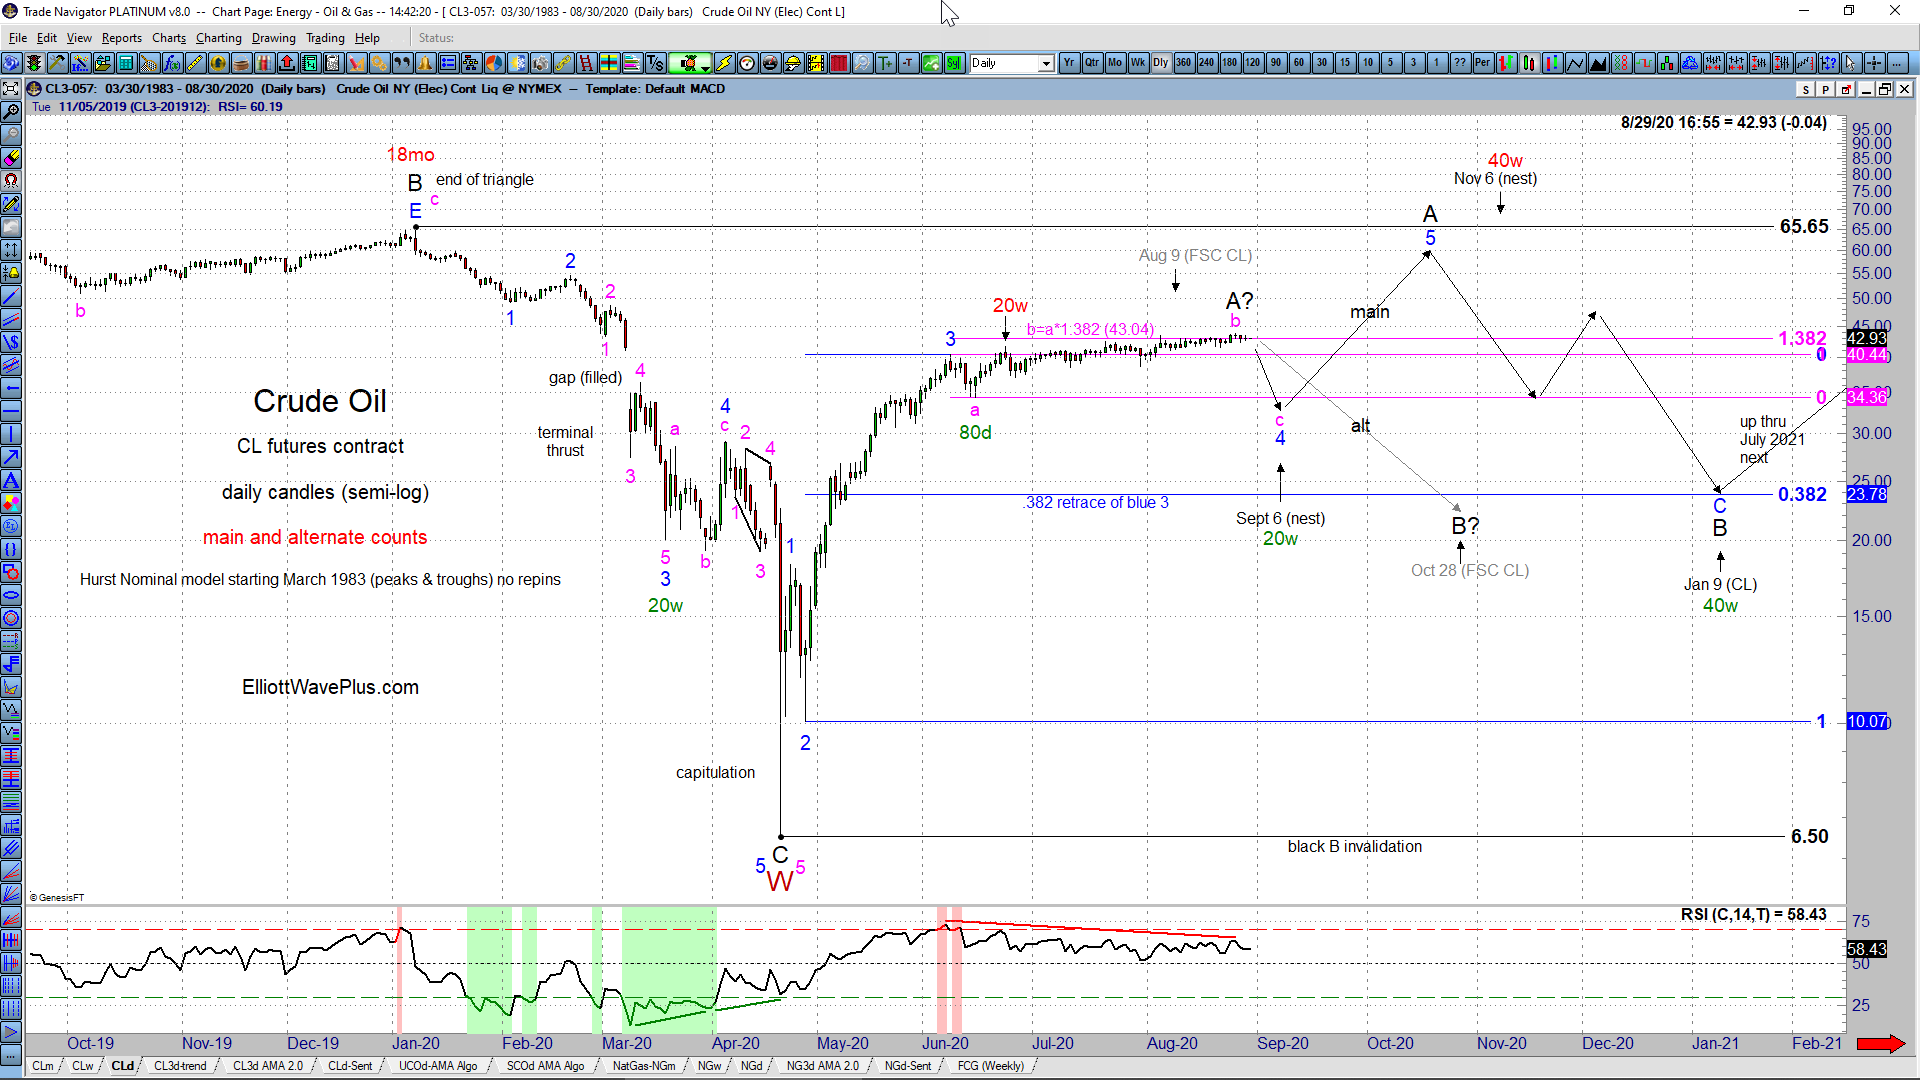
I then maintain the trade by revising my Profit Targets based on the Sid Norris/ElliottWavePus Roadmap. Following the confirmation of a market swing, during the next Sunday Webinar, Sid confirmed the Elliot Wave Structure and then computed a Fibonacci Target. I then reset my exit target based on Sid determination. Being conservative in my trading, I always set my target slightly less than the Fib target. It is always better to go home with money in my pocket! Here’s a screenshots of my on-chart notes:
{And here was Sid’s combined Elliott Wave and Hurst Cycles Roadmap for Crude Oil (daily chart) on Sunday, August 30:}
A Few More Subtleties Regarding Interpretation of the Indicators:
The Predictive Strength of DMI – The DMI gives some really great indications of Momentum! I show an example on the /CL chart for the period from August 5 to August 19. Price is clearly rising during this period. The slope of the SMA line is positive, The Trailing Stop line is clearly showing a rise in price over this time, the trend is up because DMI+ is above DMI-. However, the slope of the DMI+ line is negative! Why is this? The reason is there is no strong buying pressure in the crude oil market! The Momentum of the move up is negative! This is a GREAT presaging of the coming market swing to the downside! Also interesting during these same dates, the ADX line is still rising. This indicates the trend is strengthening, but the trend is very weak! An ADX of less than 25 is not strong enough to trade in the direction of the trend! This too, is an indication of a likely coming price swing.
More about the DMI Indicator – In Crude Oil, the ADX continued to decline until September 1, despite price making a HH on 8/26. The divergence of a HH price and declining ADX is also a trading signal! The Doji candle on August 26 occurring at the apex of the up trend with declining ADX was a great sell entry! There was also divergence with the DMI+ line. Price made a higher high (HH) but the DMI+ peak was lower than previous peak! An entry below the SMA or LRTL would have been a perfectly valid trading choice, based on all the information at hand, and would have yielded nice profits.
Lower High Sell Entry: Another entry technique is to sell a few ticks below the low of the day of the confirmed Lower High. This would have been on September 1. The SMA was a few ticks below the low of this day! A Sell Entry below the SMA at this point was a perfect trade!
Trend Line Break Entry– Yet another entry technique is a Trend Line Break. There, are trend line breaks and then there are trendline breaks. One great trendline break is the Qualified Trend Line break of Tom DeMark. One such Qualified Trend Line break is a price break below a trend line in which the prior days close was an up close. This is precisely what happened on August 2. Price moved below the rising trendline from the ITL of August 21, and the prior days close was an up close! These trend line breaks are usually very good trades.
Concerning the ATR – The ATR for crude oil prices was very small on the day prior to the range expansion of the recent price swing! This is clearly shown by the slope of the line and the ultimate very low value on the day prior to the price reversal. “Small Price Candles beget large Price Candles” It is a fact! The mystery surrounding this “Range” expansion has always been knowing which way the expansion will occur. We now have that mystery solved through the ElliottWavePlus.com Road Map! At the extremes of ATR contraction, a range expansion will occur. The opposite is also true. “Large range Candles Beget small range candles.” Something interesting can occur at the end of the large candle expansion…A market swing! More about that in another document coming soon!
Conclusion – I hope this detailed educational document provides some insights into how I follow “market structure” and how the utilization of a few simple indicators can assist in market entry timing. This is especially true in my experience when considered in harmony with Sid’s Elliott Wave + Hurst Cycles “roadmaps”.
Best Regards
William
About Elliott Wave Plus
Considering our Elliott Wave & Hurst Cycle analysis / roadmaps in conjunction with your own simple indicators can assist in market timing.
Subscriptions: We offer a number of subscription levels. Our unique approach is well worth considering, especially if you’ve never experienced wave labeling and associated Fibonacci price targets, in conjunction with independent Hurst cycle analysis. Here’s more info about subscribing to any of our plans.
Be sure to subscribe at our YouTube channel. Look for an announcement soon regarding our new regular podcasts.
Follow us on Twitter & Facebook.
(There is risk of loss in all trading. See the full disclaimer at our site.)