More Profitable Algo Trade Signals
KBE Banking Sector ETF
Elliott Wave Plus – Premium Plan
Introduction
You wanted to see more profitable algo trade signals? Our Premium Plan subscribers have received numerous hugely profitable trade signals in recent weeks. Here’s a recent example, a buy signal on KBE, a banking sector ETF. For those of you who are new to Elliott Wave Plus, our Premium Plan subscribers receive nightly trade signals and ongoing trade management instructions. We call this our Premium Plan Nightly Algo Report. It includes multiple screenshots on about twenty items, as well as a summary report. Both the screenshots and the summary report show subscribers:
- Information regarding when to enter the trade and at what price.
- The size of initial fixed protective stop.
- When and if to switch to a trailing stop.
- The size of that trailing stop.
- When to exit the trade.
How has our Premium Plan been performing? Let’s take a look at our recent coverage on KBE, the banking sector ETF.
Note: For a full list of the items covered under the Premium Plan, click here.
KBE (Banking Sector ETF)
Each of our covered trade-able instruments has its own set of algo/trading rules. KBE is no different. We show our algo rules to subscribers every night, on every screenshot. In this example, they would have seen a new buy signal the evening of the December 27, and would have placed an order to buy (for example) approximately $10,000 worth of shares at market the following day. The next day, KBE opened at $54.57 per share. In this example, the subscriber, if they wanted to buy about 10K worth of shares might have bought 183 shares costing a total of $9986.31. They also would have placed a fixed protective stop at $51.01, shown on the screenshot below. Of course, any number of shares could have been purchased at the discretion of the trader/investor.
The Settings
Our algo settings on KBE, which are based on a 3-year backtest and optimization, have gone on to suggest holding those shares of KBE. It will continue to do so until our WB indicator crosses over its 27-day moving average. The WB indicator, which is a triple smoothed RSI, is the first indicator showing below the price pane, and the 27-day moving average of the WB is one of the backtested and optimized parameters associated with the algo. So far, there has been no crossover, so the algo is still in the trade! As of this writing, the current share price of KBE is 60.04. So those 183 shares are worth $11,005.62. That’s a gain of over 10% in just thirteen trading days. While the WB indicator is starting to show signs of “toppyness”, it won’t suggest exiting the trade until it experiences a cross-over of its moving average. When that happens, all current Premium Plan subscribers will be instructed in our nightly report to close the trade the next morning at market.
Why Does This Work?
The beauty of our proprietary momentum algos is they start with an open profit objective. So, in items like this that are trending strongly, the algo will stick with the trade until a loss of momentum is detected on a daily chart. In our experience, this methodology will inevitably produce enormous winners from time to time. Catching large chunks of strong trending moves is the reason why our algos generally produce excellent profits over the long haul. Most automated trading strategies have a fixed “take profit” level that is based on a backtest period that includes some trending price action, but also lots of sideways consolidation. Any auto trading strategy that would have featured a fixed take profit amount on KBE would not have been able to take advantage of the extent of this strong trending move.
KBE (Banking Sector ETF) – Premium Plan Algo Chart 1-10-22
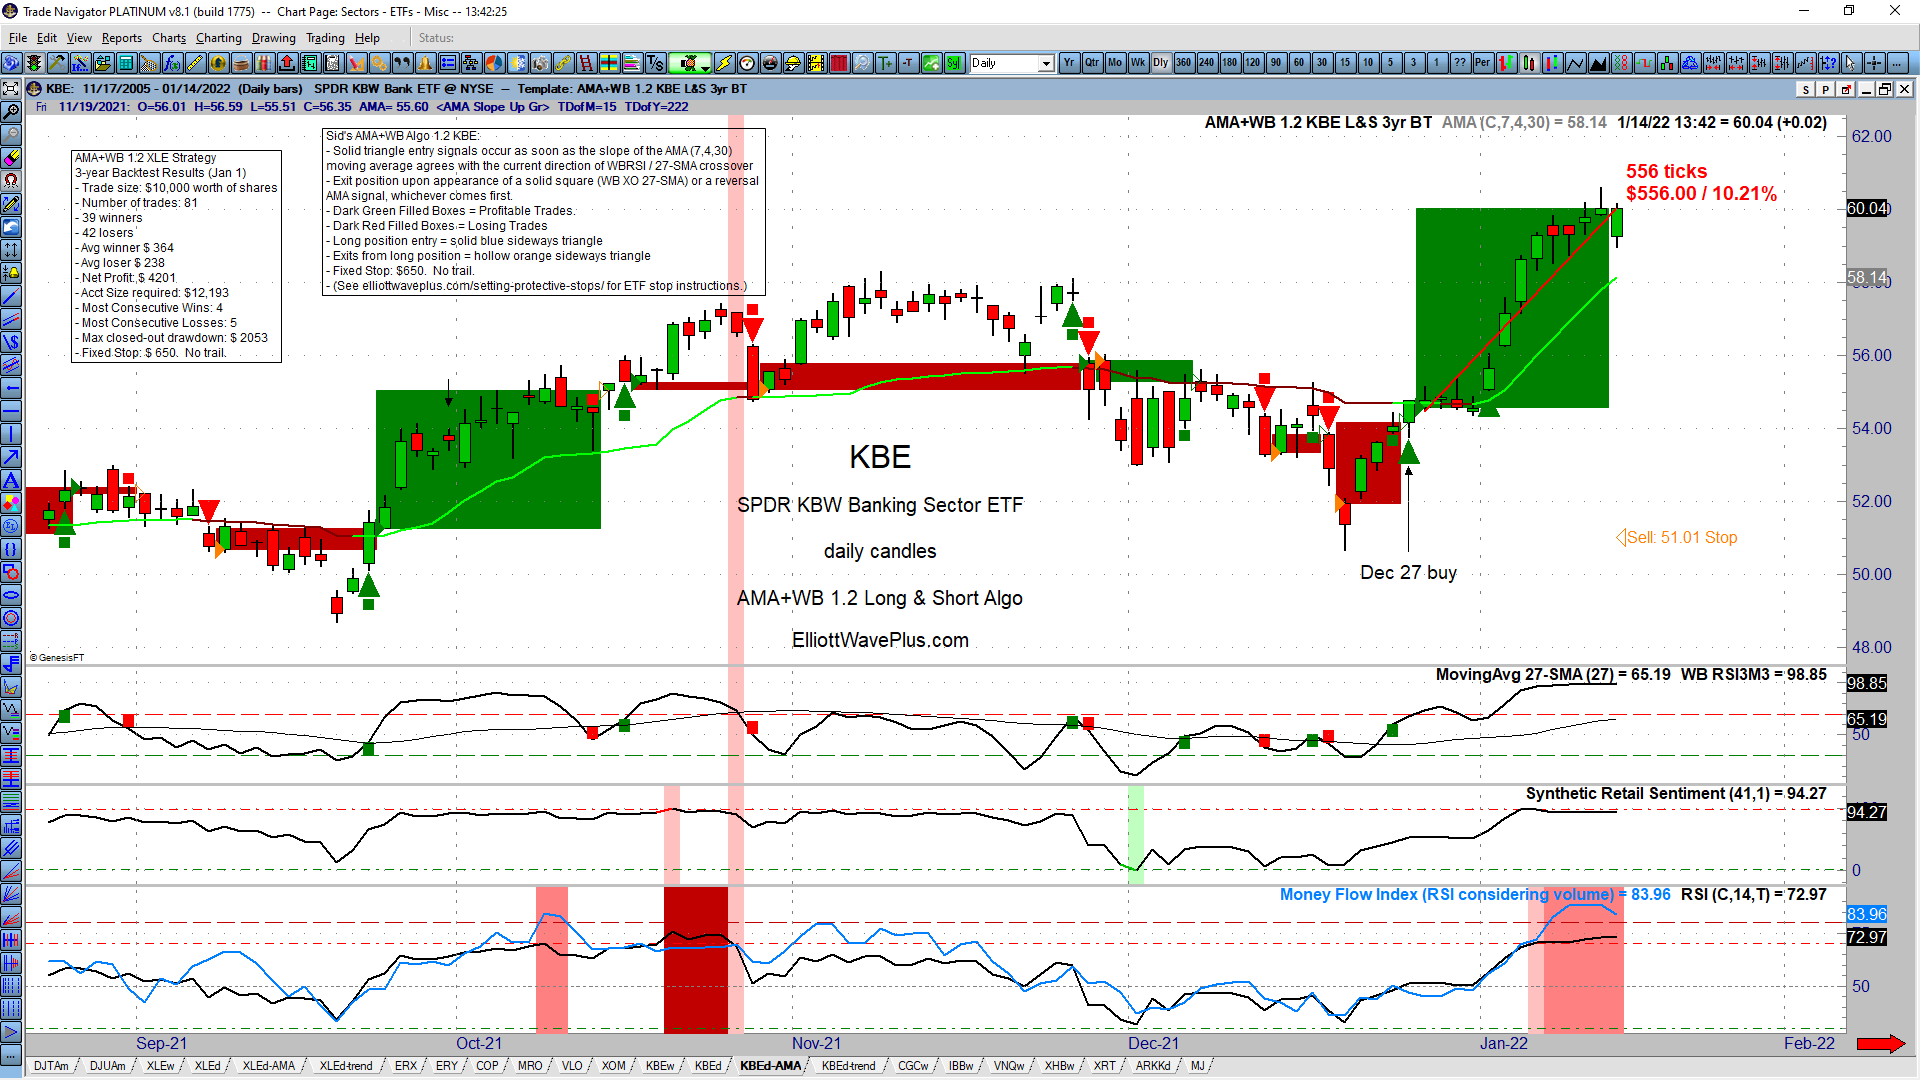
Note: The big green blocks on the chart represent winning trades, the small red blocks represent losing trades.
Elliott Wave & Hurst Cycles
In the KBE example above, our Elliott Wave count (based on Sid Norris’ Dec 22 screenshot for Basic, Pro & Premium Plan subscribers shown below) had been projecting that upward movement. A potential wave 3 of 3 to the upside was expected to commence starting at the December 20th low. Sid had also been notifying subscribers that Hurst cycle analysis was projecting that a mid-December low would produce the first 80-day cycle trough after a recent 18-month cycle trough. The combination of Elliott and Hurst was therefore clearly bullish just before the above automated algo buy signal came out. Sid was expecting things to be aggressive to the upside, and that’s exactly the way things turned out on KBE.
In our system, subscribers therefore would have had two ways of looking at this trade. Both were in agreement.

Purpose of the Nightly Algo Report
Our Nightly Algo Report provides Premium Plan subscribers with screenshots of our current AMA-Algo and Sentiment Conditions on about twenty trade-able items every night. It takes only minutes each evening to examine the nightly report and place corresponding orders if you so choose. The report provides a description of our current Elliott Wave count, the projected direction and duration of price movement based on Cycle Analysis, our current proprietary AMA algo signal positioning, trade management instructions, and current Retail and Commercials sentiment positioning. Our nightly report allows market participants to take advantage of timely trading opportunities across all popular markets, based on emotion-free technical analysis. This can be done in 5 minutes or less every evening. Action items for that evening are always color coded. If you want to see a video that explains our Nightly Report in greater detail, go to Youtube via this link: Elliott Wave Plus Premium Plan Algos
Conclusion:
We strongly believe that by diligently following a trading system yields the highest chance of success when trading the markets. Elliott Wave and associated Fibonacci price targets combined with Hurst Cycle analysis is a good start. Nightly Reports furnished with AMA algo trade signals eliminate emotion and subjectivity in trading. Sentiment charts provide traders additional information so they can be aware of rare market extremes, and potentially imminent reversals. We believe that utilizing all these resources together supplies our Premium Plan subscribers with extremely valuable and timely market trading information. Visit ElliottWavePlus.com for more information.
Sid Norris and Andrew Norris – Elliott Wave Plus
Subscriptions:
We offer several subscription levels. Our entry level is the Trend Plan ($25 mo), which provides nightly Trend information only on about 20 popular items (including several cryptos), but no Elliott Wave or Hurst Cycles. The Basic ($70 mo) and Pro ($100 mo) Plans are mostly about Sid’s future roadmaps based on his unique combination of Elliott Wave and Hurst Cycles. The Basic plan features Sunday and Wednesday screenshots of Sid’s Elliott wave counts. The Pro Plan also includes Sid’s weekly 3-hour webinar. Dozens of popular tradable items are covered. The Premium Plan ($200 mo) includes all of the above but also adds automated trend and momentum algos, as well as nightly sentiment conditions screenshots. Here’s more info about subscribing.
Be sure to subscribe at our YouTube channel.
Follow us on Twitter
Follow us on Facebook
(There is risk of loss in all trading. Past results do not guarantee future profits. See the full disclaimer at our site.)
Testimonials:
“I’ve been trading these markets (and subscribing to professional services) for more than forty years and find your work and resulting forecasts, targets, objectives, etc. to be free of personal bias, and remarkably accurate. That is why I continue to subscribe. Well done.” – W.M.
“Just a quick note from a long-term subscriber to let you know how much I appreciate your work, insight and dedication to excellence. Thank you and regards.” – J.V
Click here for many more testimonials spanning the last ten plus years.