Sid’s Elliott Wave Analysis of McEwen Mining Inc. (ticker symbol MUX)
After my recent post on First Majestic Silver Corp. (AG), I’ve received a number of requests from subscribers for my current wave count on McEwen Mining Inc. (MUX), another highly regarded stock in the precious metals mining sector. MUX, like AG, sports a low stock price, excellent current and future prospects, and a successful and experienced CEO. McEwen Mining also features a pristine, zero-debt balance sheet. The company mines primarily gold and silver, but also some copper, and owns operating mines and prospects in Canada, the US (Nevada), Mexico, and Argentina.
Let’s look at MUX stock price history from an Elliott Wave perspective, starting with a weekly, semi-log chart. (Click on the charts to enlarge)

The first thing that stands out on the weekly chart is that the rally legs appear to carve out 5-wave impulses, while the downward waves are choppy and overlapping. I am therefore labeling the Oct 2008 thru April 2011 leg as a large cycle-degree (teal) wave 1 or A, and the April 2011 thru July 2015 bear market as a cycle-degree wave 2 or B. Then, from July 2015 thru July 2016, there was a crystal clear 5-wave impulse to the upside. Notice the obvious wave 3 of 3 price action in the middle of that leg up. Amazingly, MUX stock rallied over 650% during that 12-month period, from 65 cents per share to $4.92 per share.
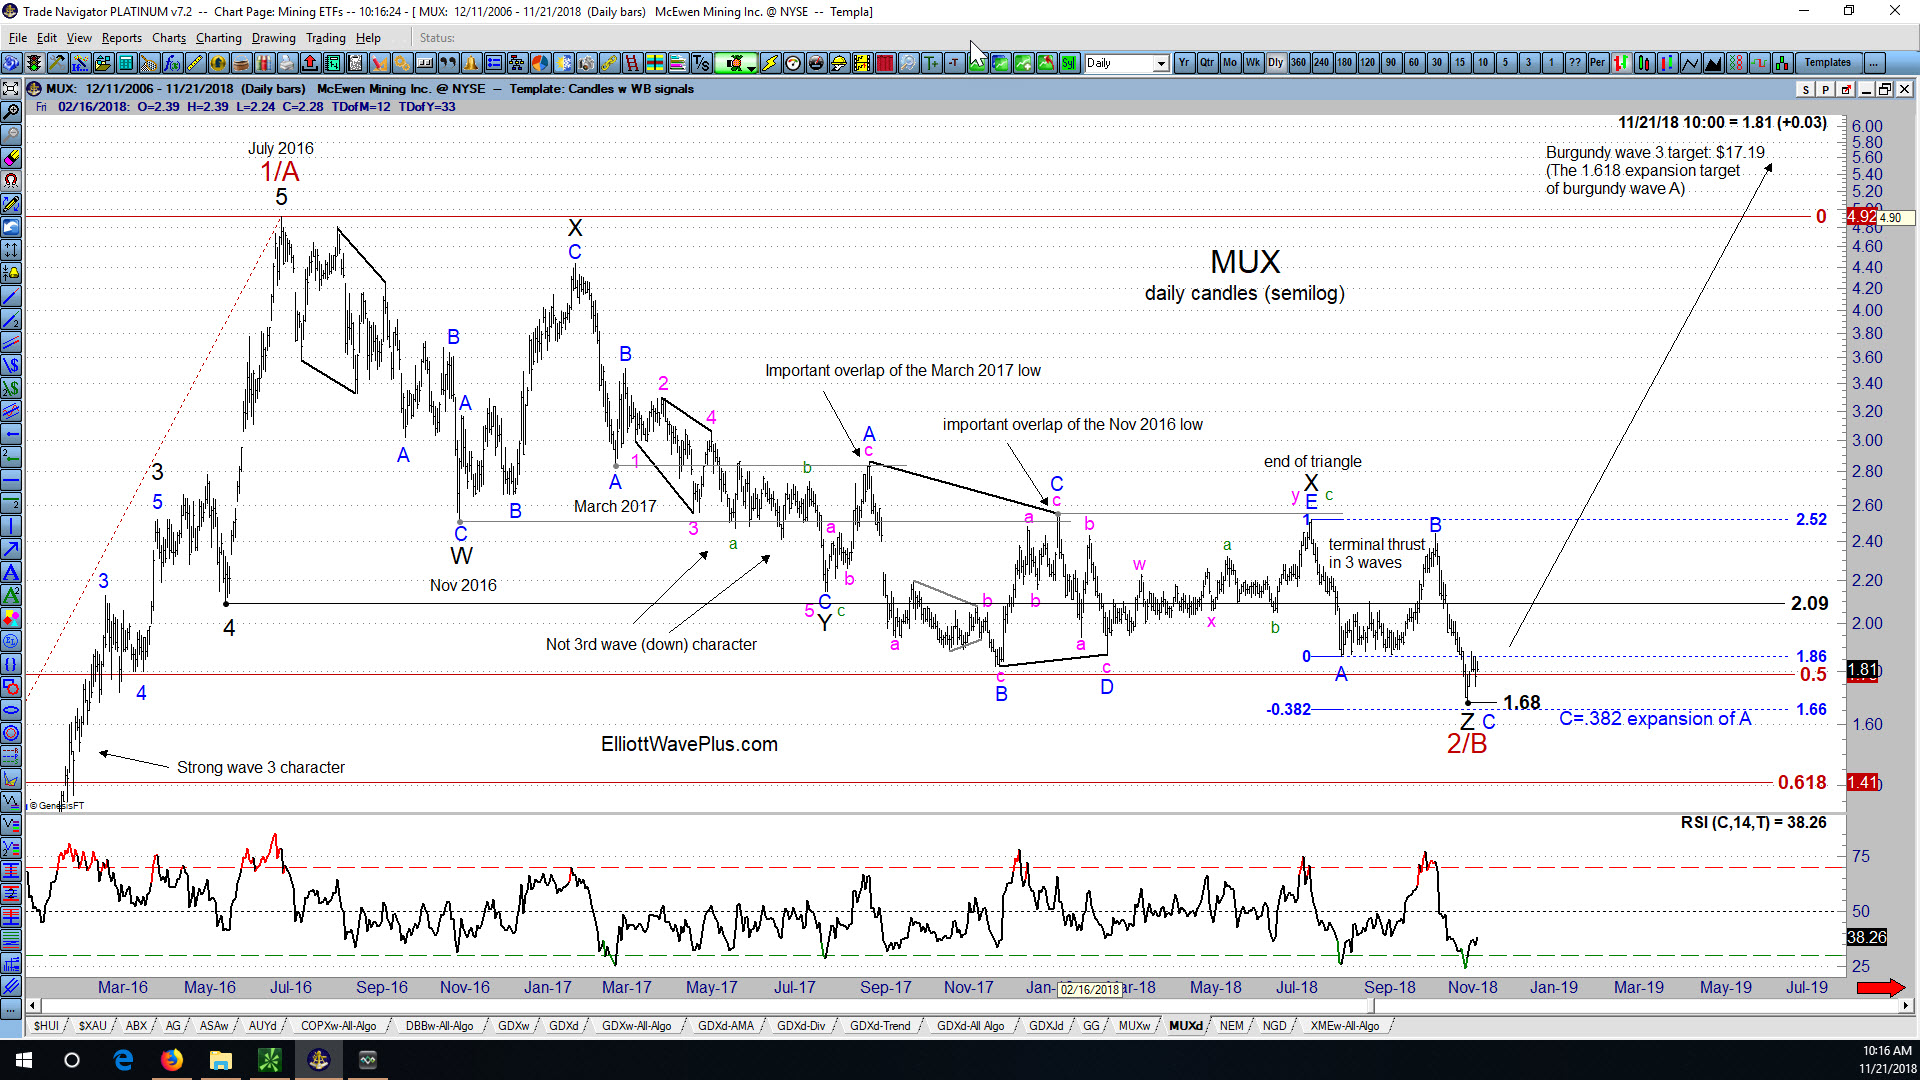
That powerful move to the upside woke up precious metals mining stock investors in a big way, after more than 4 years of languish in the sector. Unfortunately, that strong one-year long move to the upside was followed by more than two years now of disappointing downward price action. This wasn’t exactly what many precious metals sector investors had hoped for. However, there is bullish hope embedded in the internal wave structure. Notice the downward price action since July 2016. It cannot be counted as impulsive. There is no strong wave 3 price action, and there are two important price overlaps during the most aggressive period of downward price movement, from March thru December 2017. I am therefore labeling the downward movement in MUX from July 2016 thru Nov 2018 as a corrective WXYXZ pattern. That pattern could easily have finished just a few days ago, on November 14.
From a Fibonacci perspective, if MUX did bottom (finally) in mid-Nov 2018, it stopped going down very near the 50% retrace level of the 2015-16 bull. If my wave count is correct, and the July 2018 high ended an intermediate-degree black X triangle, the downward thrust from that triangle would be a final Z wave of the WXYXZ structure, and would internally subdivide into a 3-wave blue ABC to the downside. As you can see on the chart, it’s pretty obvious where the blue A and B labels belong. So the question becomes, is blue wave C to the downside finished? Notice that the downward movement from the Oct 2018 blue B high of $2.44 moved down aggressively into mid-Nov, and very nearly hit a common Fibonacci price target for wave C of a zigzag, where wave C would equal a .382 expansion from the end of wave A (on a semi-log chart). That target was $1.66, and on Nov 14, MUX hit $1.68. Pretty darn close.
So what’s next for McEwen Mining’s stock price from an Elliott Wave and associated Fibonacci price target perspective? The minimum expectation would be that MUX would need to move up next to above the July 2016 high of $4.92. More lofty targets come into play with Fibonacci. If Primary (burgundy) wave 3 (main count) moved to a 1.618 expansion of burgundy wave A, MUX would eventually hit $17.19, and that would not be the end of the rally. There would still be a burgundy wave 4 and 5 yet to go. A more conservative upside target would have (alternate count) burgundy wave C reaching equality with burgundy wave A at $12.72 per share, if the Nov 14 low of $1.68 is the end of burgundy B.
Conclusion: McEwen Mining Inc. stock, ticker symbol MUX, may have bottomed at $1.68 per share here in mid-November 2018, and is likely to move above its 2016 high of $4.92 before it can make a new low below it’s mid-2015 low of 65 cents. Much higher targets are possible. Considering the recent historic levels of extreme sentiment in Gold and the US Dollar, it seems highly likely that if MUX has not found a bottom yet, that long-awaited bottom is very close at hand.
Invitation: Please join me for my next weekly “Counts” Webinar, where I go over my Elliott Wave counts and associated Fibonacci price targets for many of the world’s major stock markets, commodities, currencies and bonds. Hurst cycle analysis as well as a number of other forms of technical analysis will also be considered on virtually all items. Don’t have time for a webinar? There are three tiers of paid subscriptions to choose from. A growing number of traders worldwide trust and prefer the information we provide. Thank you for your consideration.
Updated wave count added April 23, 2019:

Sid Norris – ElliottWavePlus.com