Elliott Wave Analysis of First Majestic Silver Corp (ticker symbol AG)
First Majestic Silver Corporation (AG) is a Canadian silver mining company with six operating mines in Mexico. It is engaged in the exploration, development and production of silver, and has a current market cap of just under one billion (US$). First Majestic holds excellent growth prospects. The company’s annual silver production has grown rapidly during the past decade. AG’s low stock price combined with low long-term debt have made it a popular portfolio holding among mining sector investors.
Since AG’s August 2011 high of $26.88, the company’s stock price tumbled all the way down to $2.40 per share in January 2016. Let’s look at the price action in AG starting at that January 2016 low from an Elliott Wave perspective. (Click on the chart to enlarge)
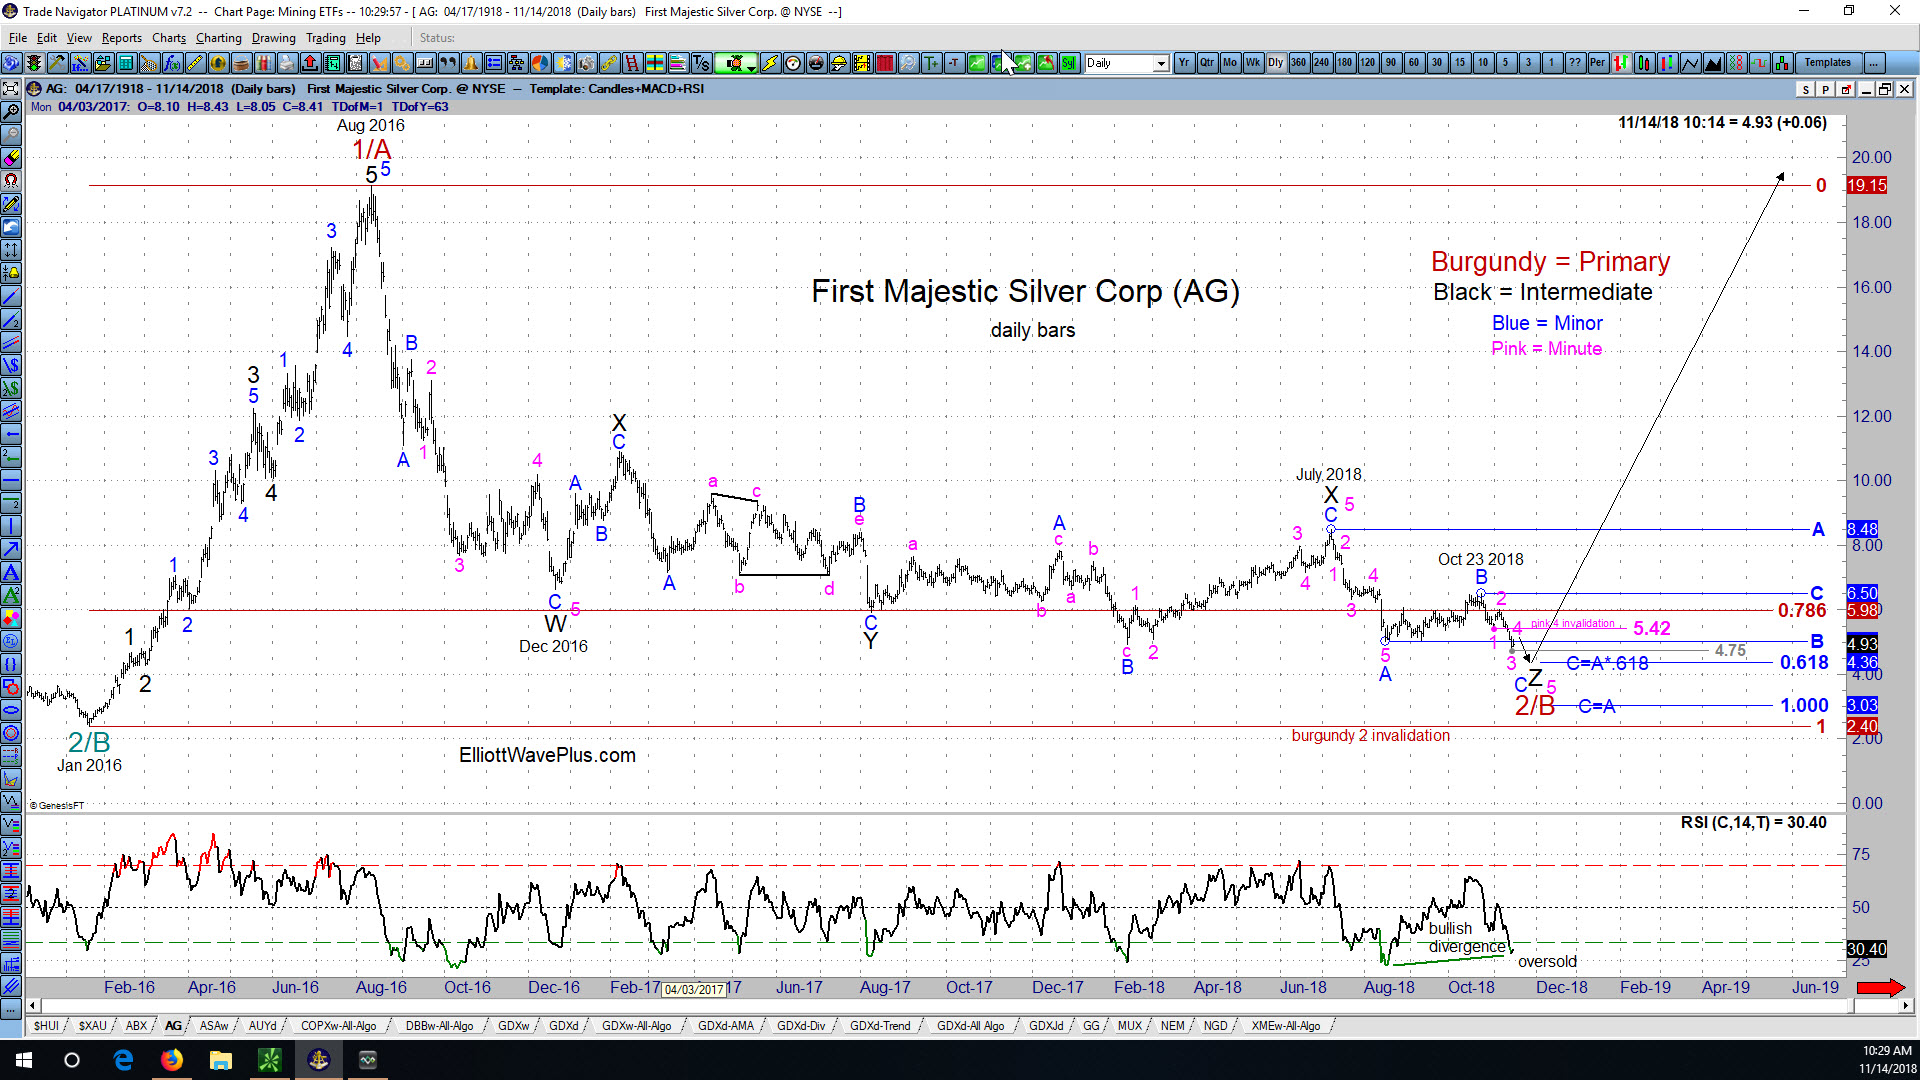
Notice the large 5-wave non-overlapping impulse to the upside from January 2016 thru August 2016. That was a very important development, because it came after a 4+ year massive bear market to the downside. That upward impulse is therefore very likely to be a wave 1 of an eventual 5-wave impulse to the upside, or wave A of an eventual 3-wave upward zigzag. Either way, another 5-wave up structure, ending above the Aug 2016 high of $19.15 is highly likely to occur before AG moves below its Jan 2016 low of $2.40.
Equally important is the character of the downward movement in AG since the Aug 2016 high of $19.15. Admittedly, the initial downward movement through December 2016 was aggressive. However, subsequent downward price action has been choppy, overlapping and gradual. In other words, there is no strong third wave component to the downward price action from Aug 2016 thru present. That entire downward period is therefore corrective, and very likely a wave 2 or wave B (burgundy).
Because of the choppy overlapping nature of the bear market in AG since Aug 2016, I believe it counts best as a nearly complete WXYXZ structure. The final Z wave (black) of the structure appears nearly complete as a blue ABC zigzag down from the July 2018 high. If blue wave C equals blue wave A times .618, the target price for the bottom in AG is $4.36. Importantly, the downward movement since Oct 23 appears to have carved out only 3 internal sub-waves so far. In my opinion, a 4th and 5th wave (in pink) are required to complete the structure, although a truncated 5th wave (pink) is possible.
Finally, there are many reasons to believe that silver itself is very close to bottoming here in mid-November 2018, not the least of which is the historic condition of extreme sentiment exhibited by virtually all market participants.
Conclusion: First Majestic Silver’s stock price is nearing an important low (best target IMO = $4.36), after which a rally to above $19.15 per share is expected.
Invitation: Please join me for my next weekly “Counts” Webinar, where I go over my Elliott Wave counts and associated Fibonacci price targets for many of the world’s major stock markets, commodities, currencies and bonds. Hurst cycle analysis as well as a number of other forms of technical analysis will also be considered on virtually all items. Don’t have time for a webinar? There are three tiers of paid subscriptions to choose from. A growing number of traders worldwide trust and prefer the information we provide. Thank you for your consideration.
Sid Norris – ElliottWavePlus.com