Elliott Wave Plus
2020 Algo Signals Trading Results
S&P-500
Introduction: Welcome to the Elliott Wave Plus S&P-500 review. This is the first installment in a short series where we reveal recent trading results based on our proprietary momentum-algo trading signals on many popularly traded items. Our Premium Plan subscribers receive trade signals and trade management instructions in real time (nightly). We provide subscribers algo screenshots nightly on about twenty items, including information regarding when to enter the trade and at what price, the size of initial fixed stop, when and if to switch to a trailing stop, the size of that trailing stop, and when to exit the trade. 2020 has been a historic year for the U.S stock market, especially when it comes to volatility. Let’s see how our signals on the S&P-500 (ES futures contract) produced almost 500% in theoretical gains so far this year.
SPX ES Contract
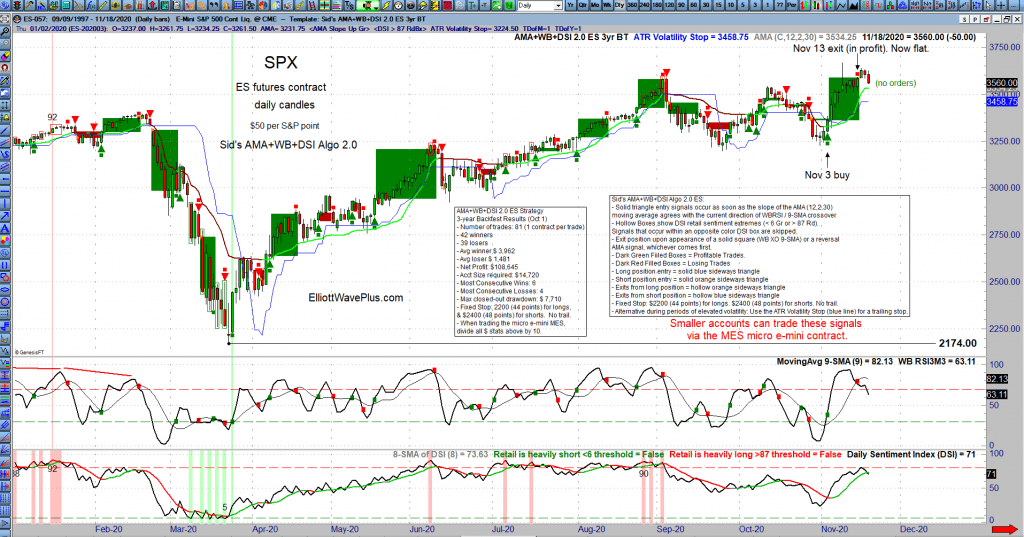
This first blog post in the series with feature an instrument of high interest, the S&P-500 (ES futures contract). The S&P-500 has seen a lot of volatility since the beginning of the year. We’ve seen record highs followed by a dramatic 38% plunge, followed by a return to all-time highs. Such volatility has made it difficult for many traders to confidently hold their positions. Many traders opt out of holding positions overnight in fear of drastic swings after hours. So how did our proprietary trade signals perform? Check out our AMA-Algo chart below. The large green boxes represent winning trades, and the smaller dark red boxes represent losing trades. As you can see, the winners can be quite large, but the losers are limited thanks to the utilization of protective stops.
Note: We perform a new 3-year back-test and re-optimization on all our algo indicator settings every quarter.
SPX (ES) – AMA Algo Chart
*Note the box key with verbiage explaining how to interpret the on-chart signals.
Premium Plan subscribers at Elliott Wave Plus receive screenshots of our proprietary AMA-Algo ES contract every evening Monday-Friday all year. Had our subscribers traded one contract every time they saw a buy signal (large green triangle) or a sell signal (large red triangle) and exited that trade following an ‘exit trade’ signal, here’s what the results would have looked like, had current algo settings (last updated Oct 1) been in place all year:
Elliott Wave Plus S&P-500 Results for 2020
Suggested Starting Account Size: $13,745
Number of Trades: 24
Total Profit: $66,080
Largest Winner: $16,033
Return Percentage: 480%
——————————————————————————————————————————-
Sentiment Conditions Charts
Also provided to subscribers each evening is a current “Sentiment Conditions” chart. This provides a lot of useful information including current retail and commercials positioning, using several measures. Sentiment extremes often predict trend changes.
Purpose of the Nightly Algo Report
Our Nightly Algo Report provides Premium Plan subscribers with screenshots of our current AMA-Algo and Sentiment Conditions on about twenty trade-able items every night. It only takes a few minutes every evening to examine our report and place corresponding orders. The report provides a description of our current Elliott Wave count, the projected direction and duration of price movement based on Cycle Analysis, our current proprietary AMA algo signal positioning, trade management instructions, and current Retail and Commercials sentiment positioning. Our nightly report allows market participants to take advantage of timely trading opportunities across all popular markets, based on emotion-free technical analysis. This can be done in 5 minutes or less every evening. Action items for that evening are always color coded.
Conclusion:
We believe that by diligently following a trading system yields the highest chance of success when trading the markets. Elliott Wave and associated Fibonacci price targets combined with Hurst Cycle analysis is a good start. Nightly Reports furnished with AMA algo trade signals eliminate emotion and subjectivity in trading. Sentiment charts provide traders additional information so they can be aware of rare market extremes, and likely reversals. We believe that utilizing all these resources together supplies our Premium Plan subscribers with valuable and timely market trading information. Visit ElliottWavePlus.com for more information.
Sid Norris and Andrew Norris – Elliott Wave Plus
Subscriptions:
We offer a number of subscription levels. Some are mostly about future roadmaps based on a combination of Elliott Wave and Hurst Cycles, and others are based on automated trend and momentum algos. Firstly, Sid presents his Elliott wave counts, which include integrated Hurst cycle analysis on over one hundred trade-able items for subscribers (Basic Plan & up) every weekend. Secondly, he sends out updates on the most popular of those items every Wednesday. Thirdly, Trend Report and Premium Plan subscribers receive screenshots nightly, as described in prior blog posts. Sid’s unique approach is well worth considering, especially if you’ve never experienced wave labeling and associated Fibonacci price targets that are derived in harmony with independent Hurst cycle analysis. Here’s more info about subscribing.
Be sure to subscribe at our YouTube channel.
Follow us on Twitter
Follow us on Facebook
(There is risk of loss in all trading. Past results do not guarantee future profits. See the full disclaimer at our site.)
Testimonials:
“Sid, you continue to yield remarkable results – your silver analysis has been nothing short of spectacular this year and I have made enormous profits this year thanks to it. Booked another huge silver profit ( this time short ) based on your perfect analysis. God has blessed you my friend with great wisdom- thanks for sharing it with others !” – J.F
“Just a quick note from a long-term subscriber to let you know how much I appreciate your work, insight and dedication to excellence. Thank you and regards.” – J.V
Click here for many more testimonials spanning the last ten plus years.


