How I Eliminated Emotion and Directional Bias from my Elliott Wave Counts – A blog Post by Sid Norris of ElliottWavePlus.com
I’ve been labeling charts using Elliott Wave theory for a very long time. I’ve also always tracked the Elliott Wave interpretations (wave counts) from several published wave counters over the years. Almost everyone familiar with Elliott Wave theory knows that Robert Prechter, who thankfully brought the wave principle back from obscurity more than four decades ago has generally leaned toward publishing bearish long-term US stock market wave counts for decades. Other lesser known wave counters constantly present the most bullish wave counts imaginable. One massive perma-bull even counts the 2000 high as Supercycle wave 1, and the 2009 low as Supercycle wave 2.
How can these long-term wave counts be so completely opposite? This is a problem many students of the markets have wrestled with, resulting in a wide variety of opinions regarding the usefulness of the Wave Principle. Some simply discard it altogether as too subjective, while others continue to diligently label their charts, set associated Fibonacci price targets, and notate invalidation points. Others find Elliott Wave compelling but prefer to trust the interpretations of professional wave counters with an apparent track record of accuracy.
I wrestled with the subjectively and apparent underlying bias within anyone’s Elliott Wave counts until a few years ago when I decided to combine dissimilar methods of technical analysis with Elliott Wave. The big turning point for me was finding Hurst Cycle Analysis, which is completely unrelated to Elliott Wave, and is computer generated (by Sentient Trader software). By projecting wave counts into the future based on the date range zones of coming Hurst nests of peaks and troughs, emotion and bias has been virtually eliminated from my wave counts.
So rather than base my work on market aspects that are subject to change without notice (like fundamentals, legislation, Fed activity, news or politics), my projections of price movements into the future are based on when the coming computer-generated Hurst Cycle peaks and troughs are due, incorporated into an Elliott Wave perspective, which includes specific Fibonacci prices targets. There is no doubt in my mind that the resulting price and time projections are more meaningful and use-able in trading and investing than anything derivable from Elliott Wave (or Hurst for that matter), when used in isolation.
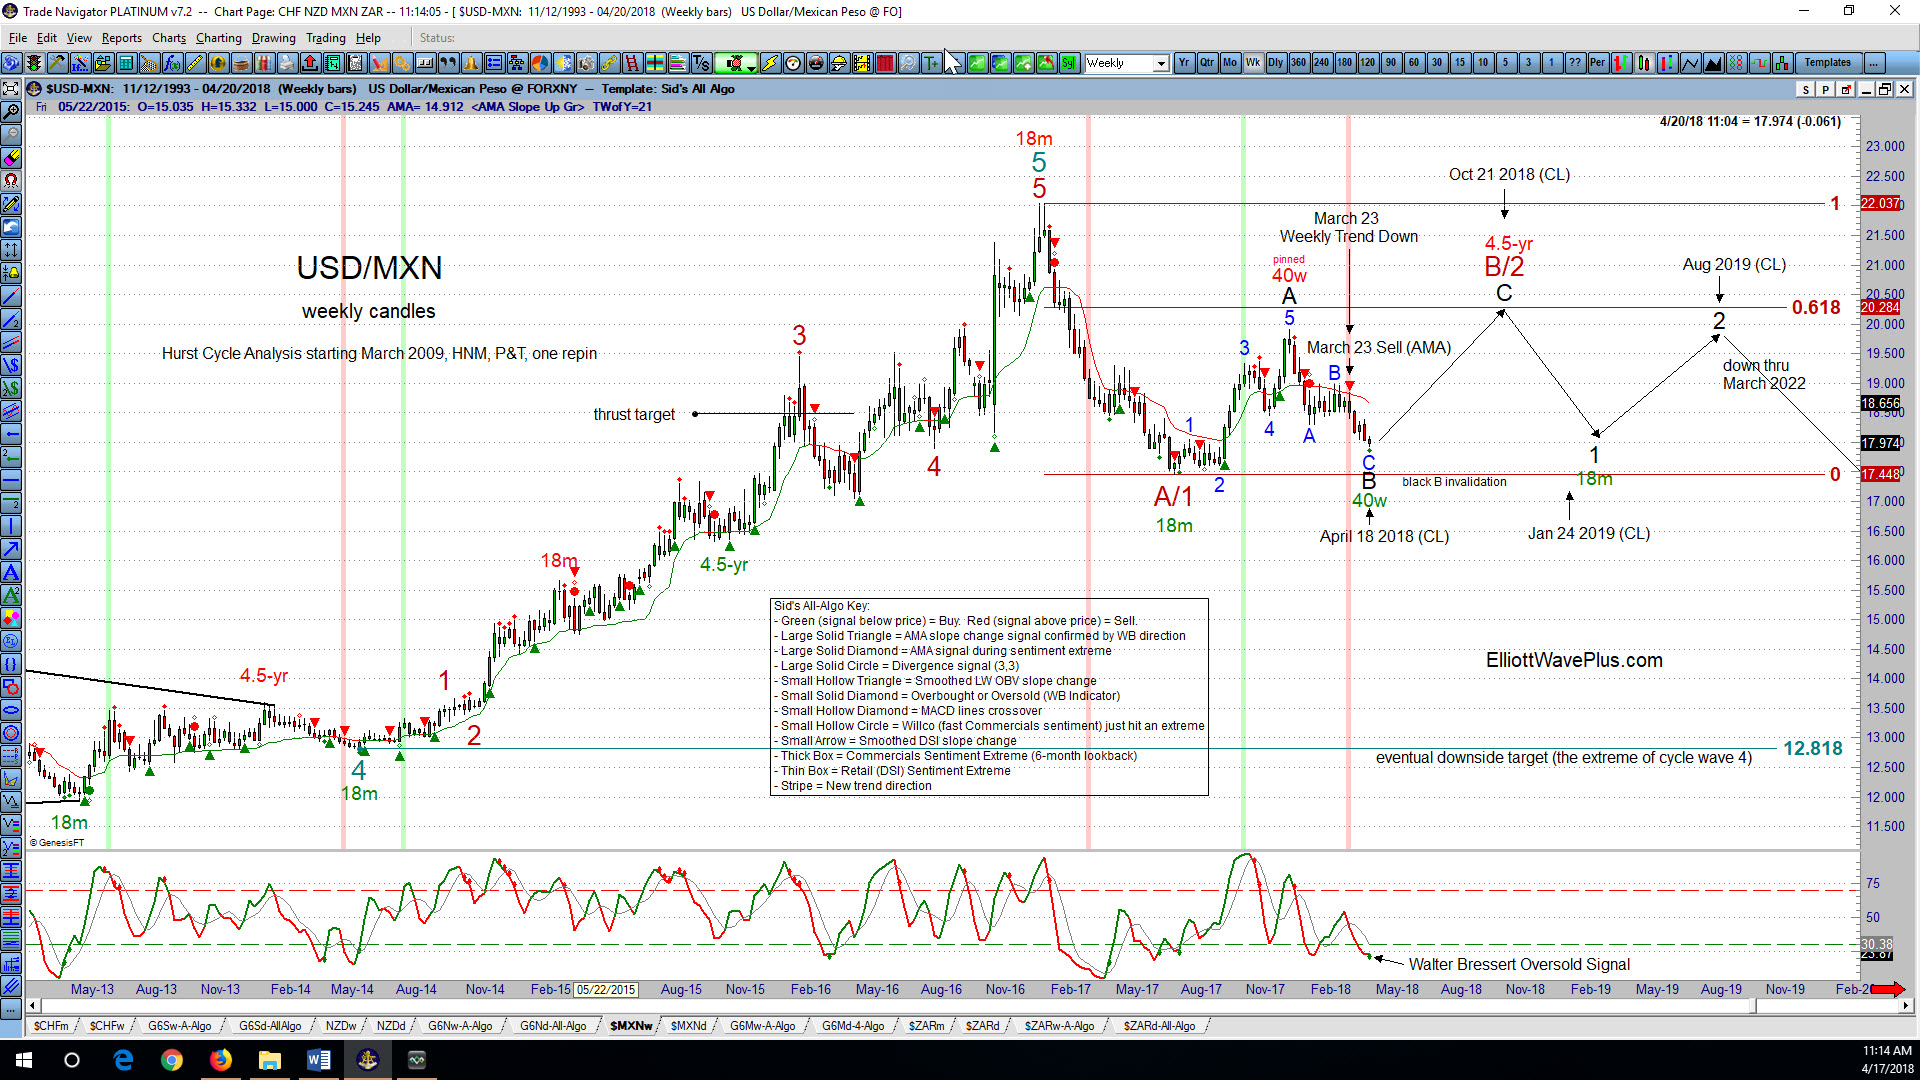
Also added to my offerings recently are mechanical trade signals based on sophisticated computer-based trading systems. For example, the graphic below is a weekly chart of the USD/MXN currency pair. Manually added notations on the chart include my Elliott Wave count labels, past and future Hurst cycle peaks and troughs, Fibonacci price targets, and nearby EW invalidation levels. Automated notations shown include my modified AMA Algo signals, my Divergence Algo signals, automated designation of trend changes, and overbought/oversold signals using Walter Bressert’s modified RSI system. Had this been a chart of the USD/MXN futures contract (G6M), it also would have included notifications of extreme trader sentiment from both Commercial and Retail traders. These mechanical, indicator-based Algo signals provide yet another layer of protection against emotional directional bias in my analysis. (Click on the charts to enlarge)
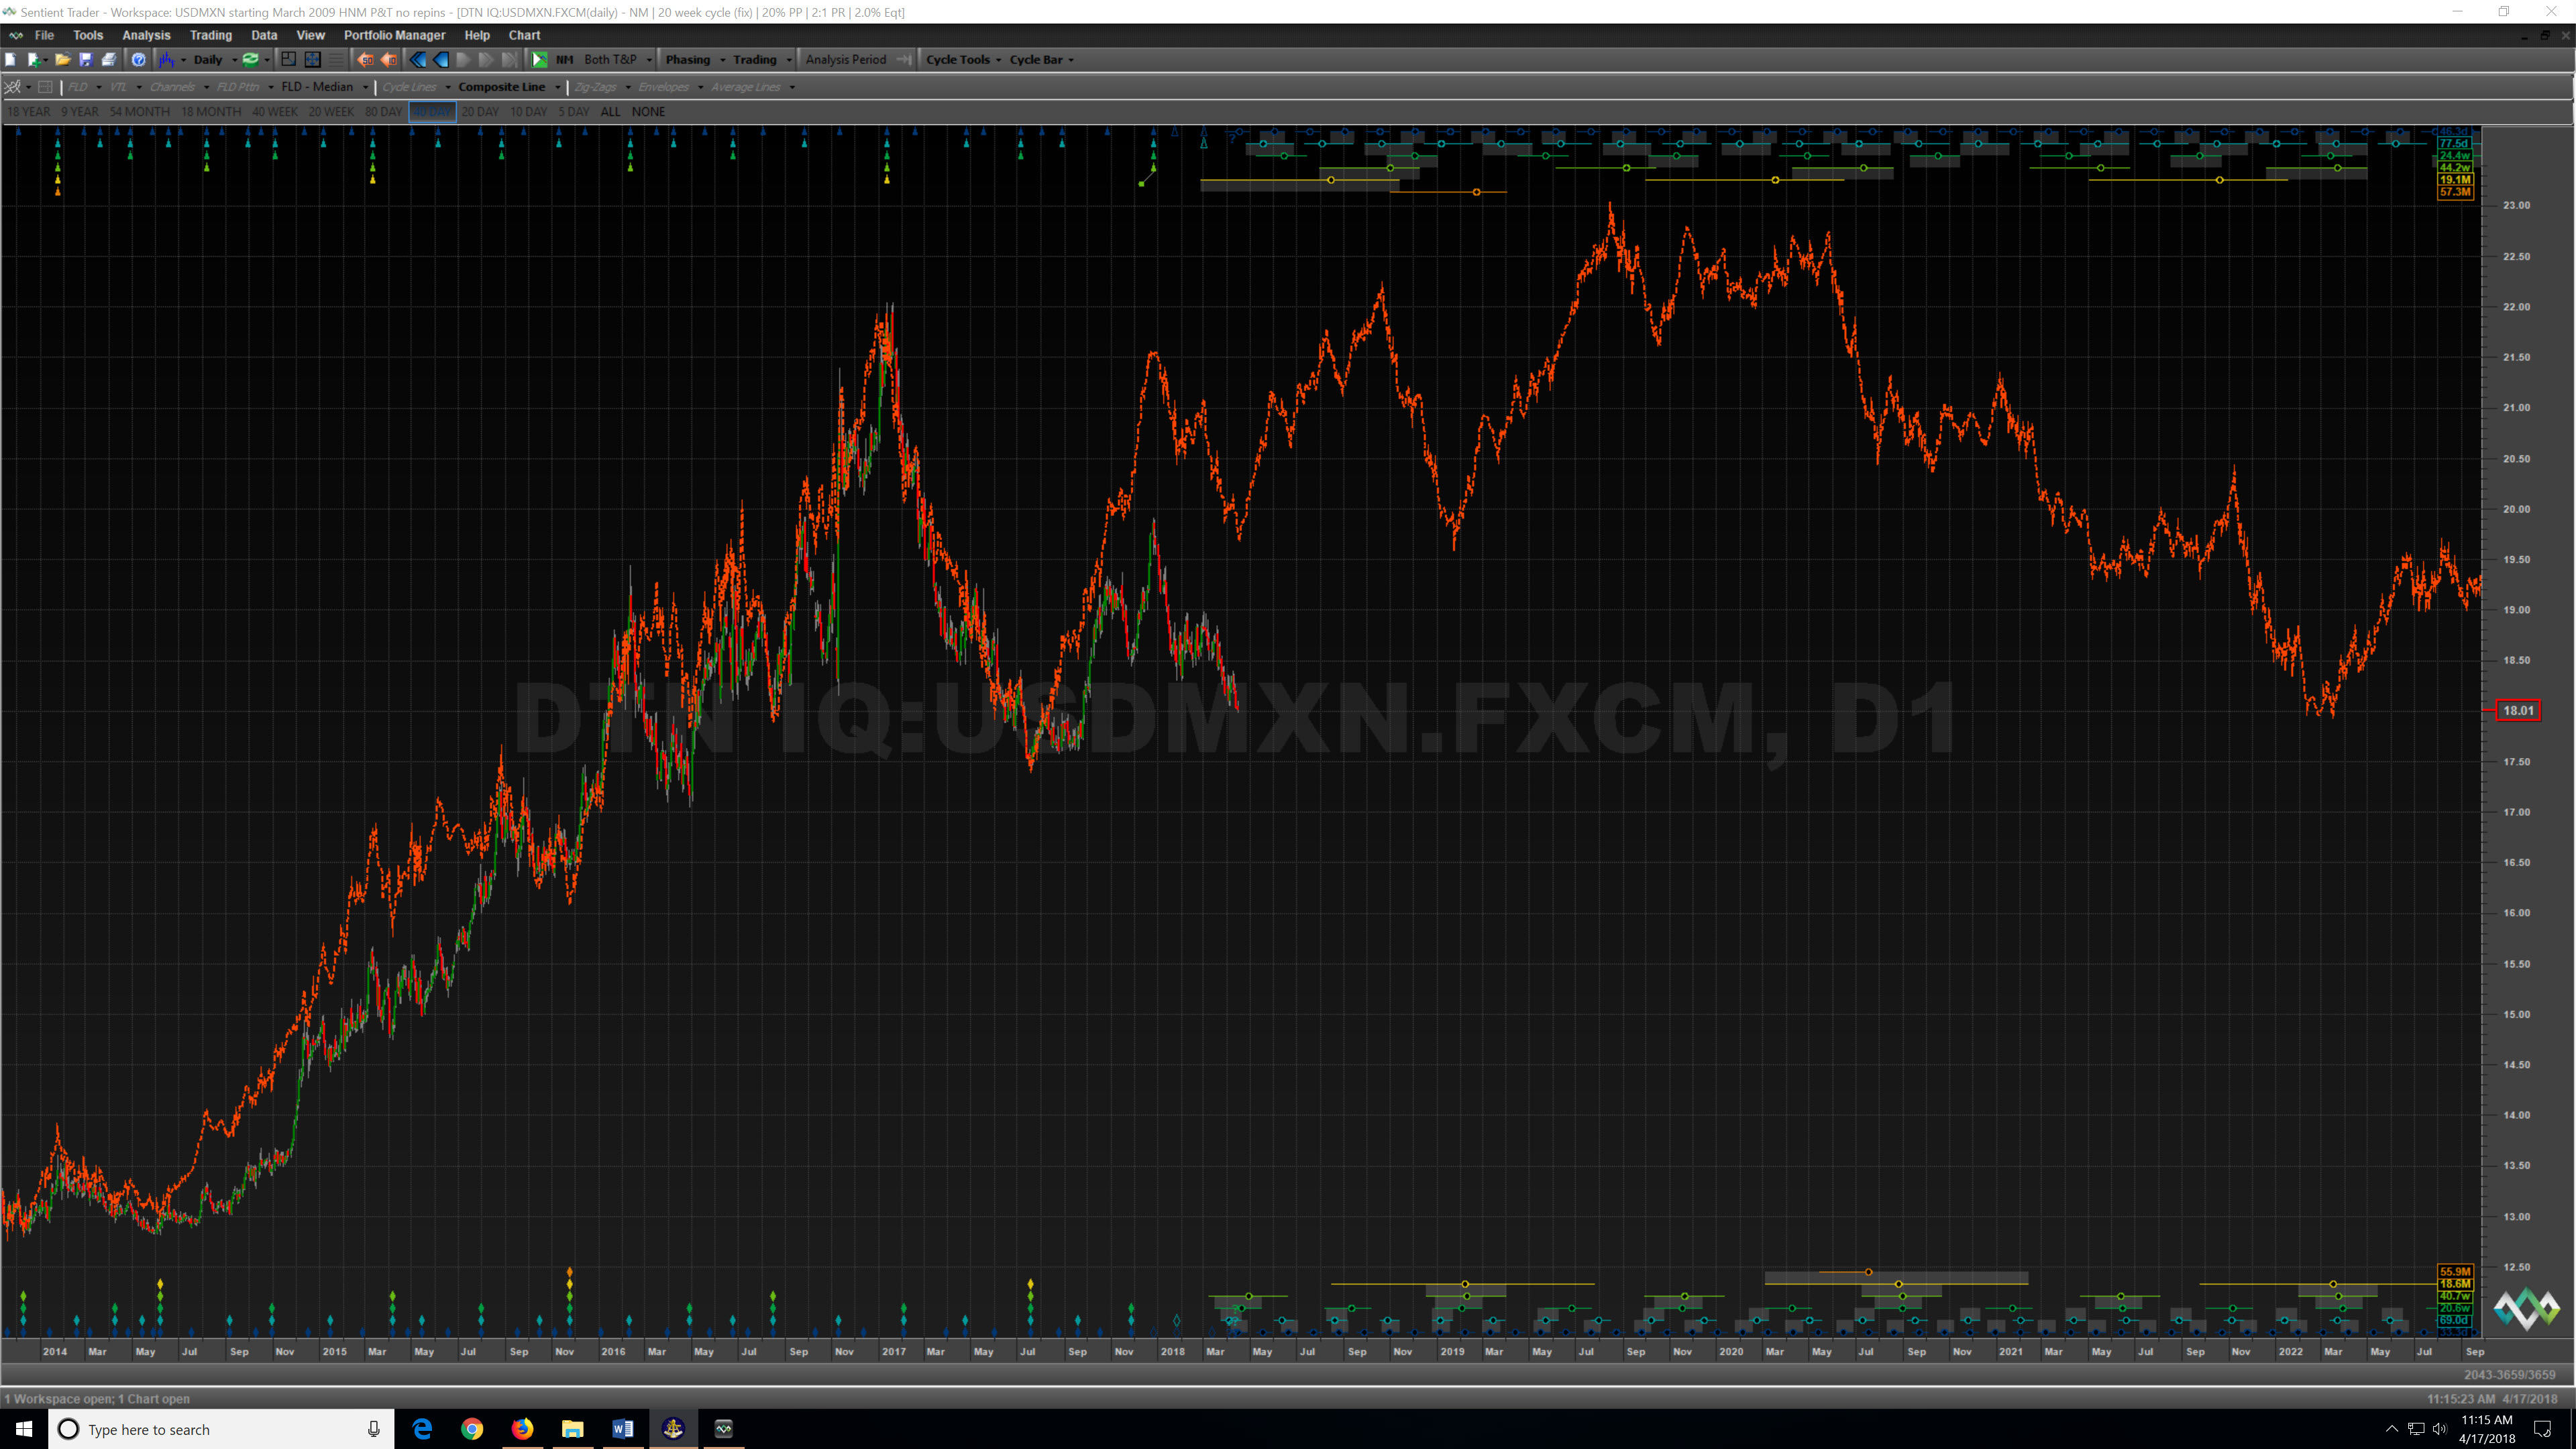
For reference, here’s a screenshot of the current Hurst Cycle Analysis on USDMXN, including the Sentient Trader Composite Line.
While at my site, be sure to check out my explanatory Videos and Guides for subscribers. They’ll help you further understand my approach to the markets, as well as the meaning behind my chart notations.
Also, please consider subscribing to one of my paid plans (Basic, Pro, or Premium). Thank you for your consideration.
Sid Norris – ElliottWavePlus.com