Quick Introduction from Sid:
I’ve come to learn over the years that many of my subscribers are very smart, highly successful people. They often look to my analysis simply as a second opinion to their own market analysis and trading techniques, which they’ve honed over decades. So I recently asked my paid subscribers if anyone would like to contribute articles to my blog. This is the first of what I hope will be many guest blog posts from subscribers, this one from Geno Jorgensen:
—
“The Best Advice I Ever Received”
By Geno Jorgensen
I spent most of my career in the construction and development business where I was lucky to have found several mentors. One of them was an older engineer, who I was lucky enough he decided I was worth teaching all he had learned in his life. At the age of 35, I found myself in Brooklyn, NY in charge of a $700 million water treatment plant. As I was studying our job site one day, the old guy must have noticed I was perplexed about something and asked: “what do you need junior”. I told him this project is not that complicated, it is just big, and we were constrained by water on three sides of the job site. I said, “If I had more real estate to spread our crews out, we could build the job a year and a half quicker and save a fortune”. Three weeks later the old man called me out to the site. He had lined the job site on three sides with 50 foot wide by 200 foot long barges. The man had actually created the additional usable real estate needed in the middle of New York City! When I thanked him for his genius, he humbly replied: “it cost me a lot of money to know what I know now”.
If you followed Sid Norris for very long you have noticed that he is cut from the same cloth as my old engineer friend. You are probably also sitting on some profits you don’t want to give back when the longer-term downtrend cycles that Sid has been pointing out for over a year now start to appear in the various financial markets and sectors. Fortunately for us, we have some mentors that have been thru this before and if we are willing to learn from them, it does not have to cost us a lot of money to know what they know. The bulk of Sid’s analysis is based on the processes of R.N. Elliott and J. M. Hurst. So, let’s see what Hurst has to say about this topic.
Hurst, like many professional traders, advocated using stop-loss orders. Unfortunately, as Hurst points out, is at what level do you establish your stop-loss. Hurst uses his harmonic nominal cycle model to establish these levels of profit preservation. Let’s assume your normal trading cycle is the 20-week cycle. Also, let’s assume you open a long position in an equity after a multiplicity of cyclic lows, such as an 18-month trough. As price moves up from this trough, the first observable cycle on your charts will probably be the 20-day cycle. As prices move away from this level, mark this low as your first stop loss level. Repeat this procedure for the 40-day trough and 80-day trough continuing to raise your stop loss level. Using other Hurst methods, you can now start accurately forecasting the top of your 20-week trading cycle. Applying this process to your trading will preserve your profits – or at least prevent substantial losses.
– Geno
—
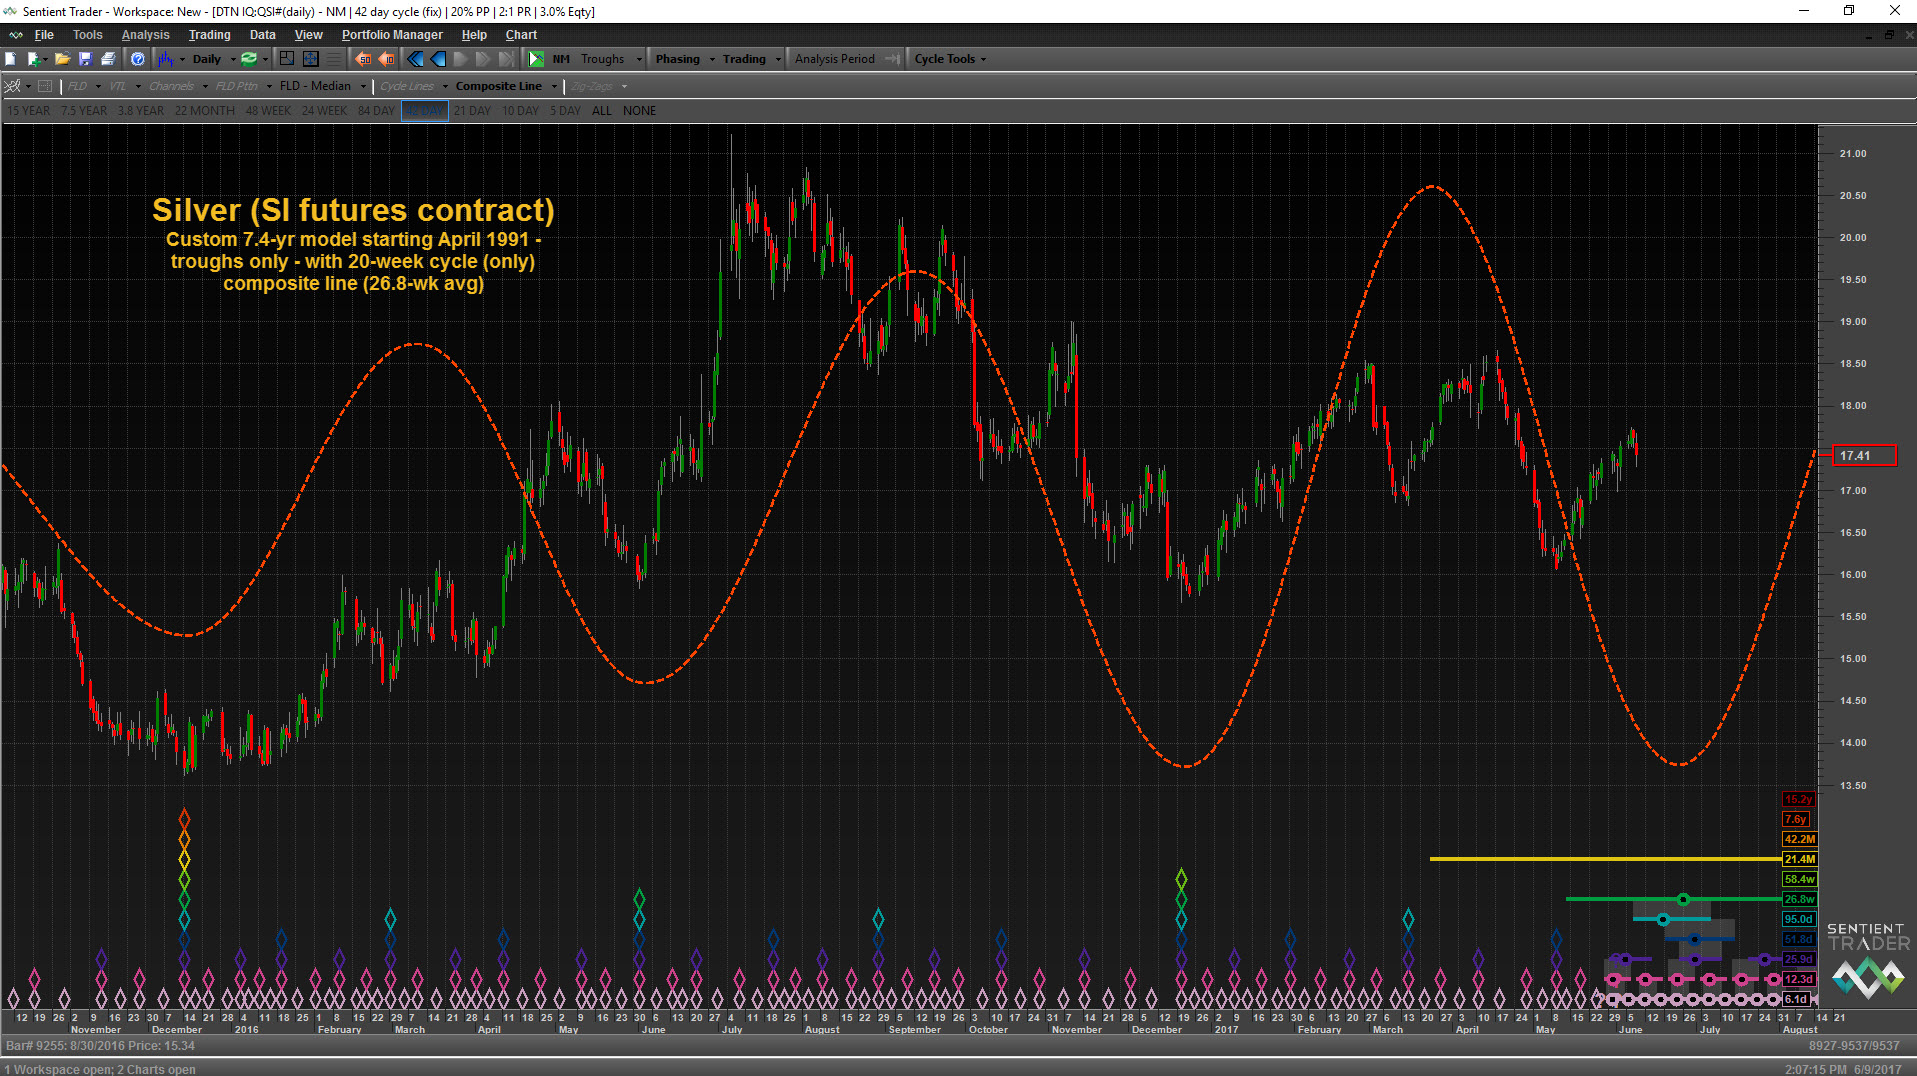
Thanks for the article Geno! I’d like to add three screenshots from Sentient Trader software that show the 20-week cycle that Geno referred to. Each chart/analysis is based on a custom 7.4-yr cycle model on Silver (the SI futures contract). This first one shows the 20-week cycle in action when the analysis is only looking at cycle troughs. Notice how the troughs are nicely pinpointed, but the peaks are a bit off:
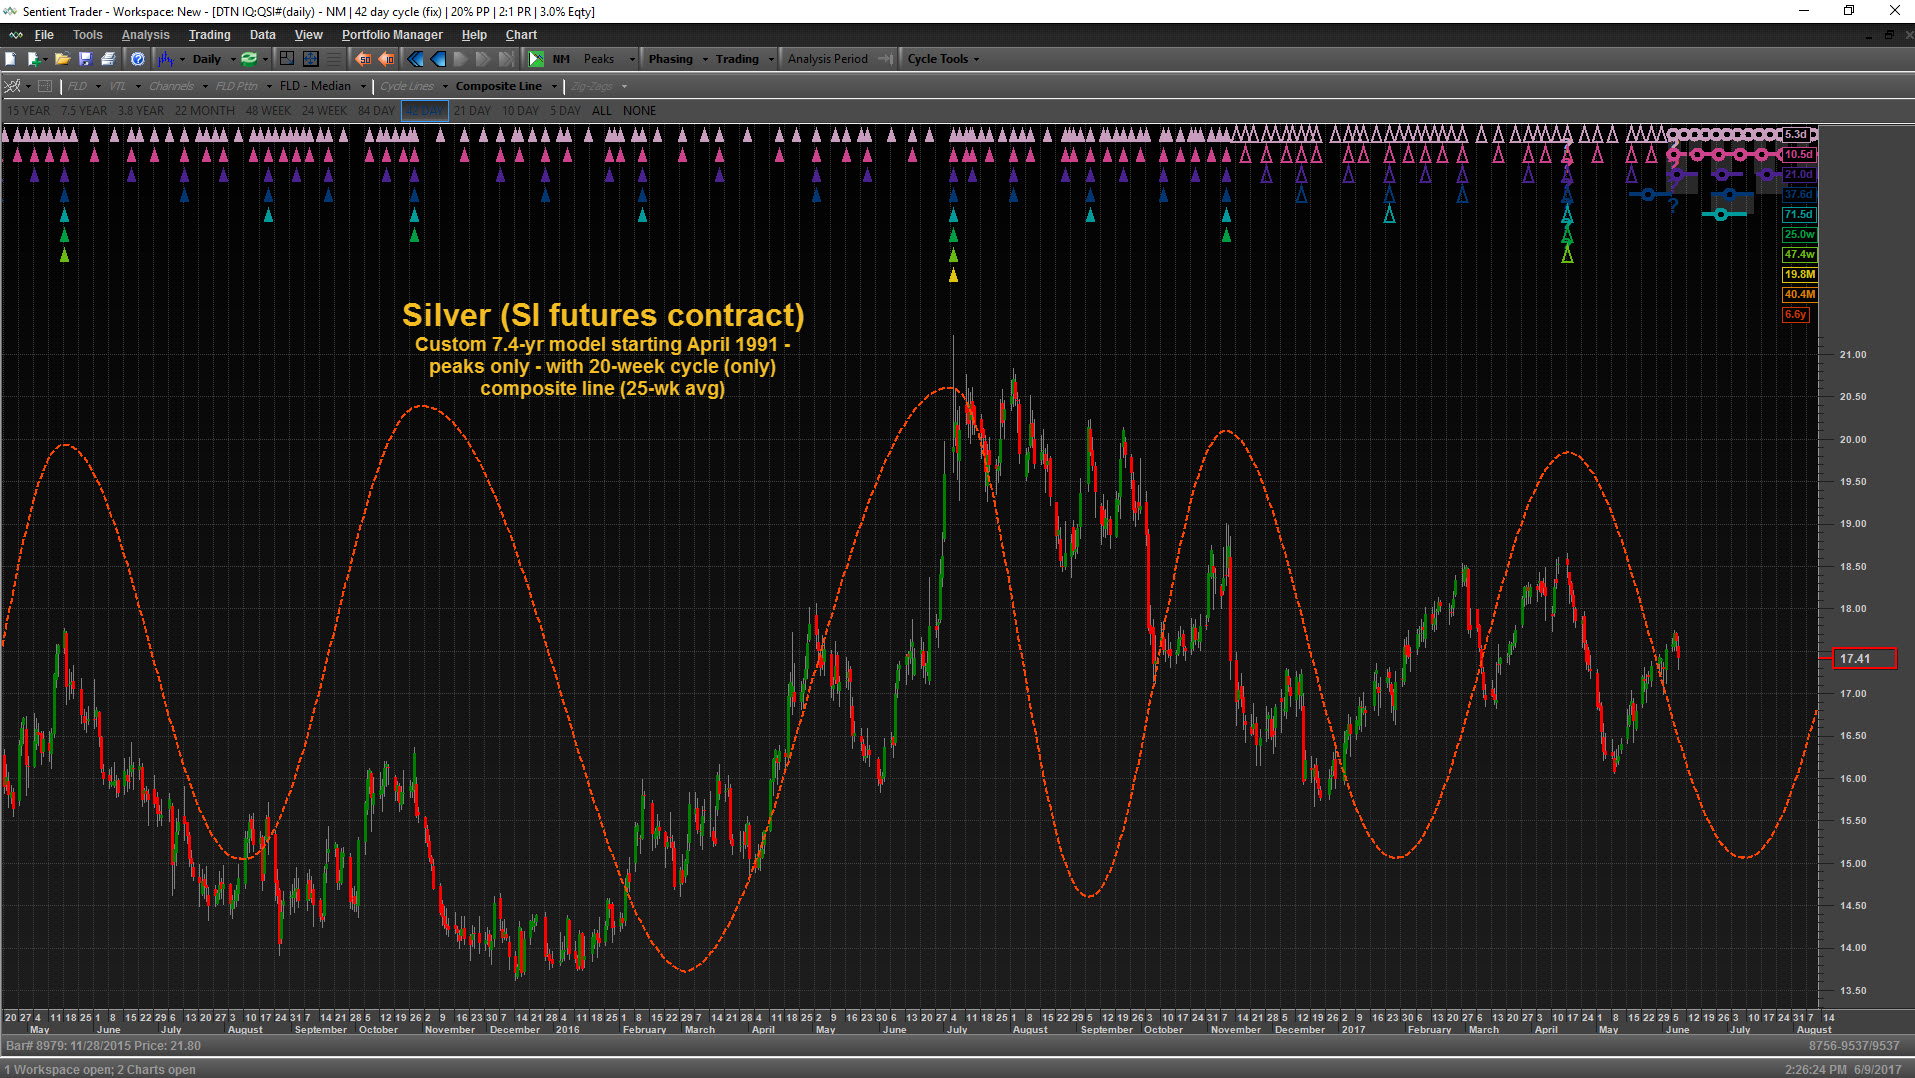
This next screenshot shows the Silver SI contract featuring once again the 7.4-yr custom model and the 20-week-only composite line, this time considering cycle peaks only. Notice how this analysis nails the peaks, but the troughs are a bit iffy:
And finally, this next screenshot shows how Sentient Trader software can create a composite line of the two 20-week cycle analyses shown above. Notice how both the peaks and troughs are accounted for nicely:
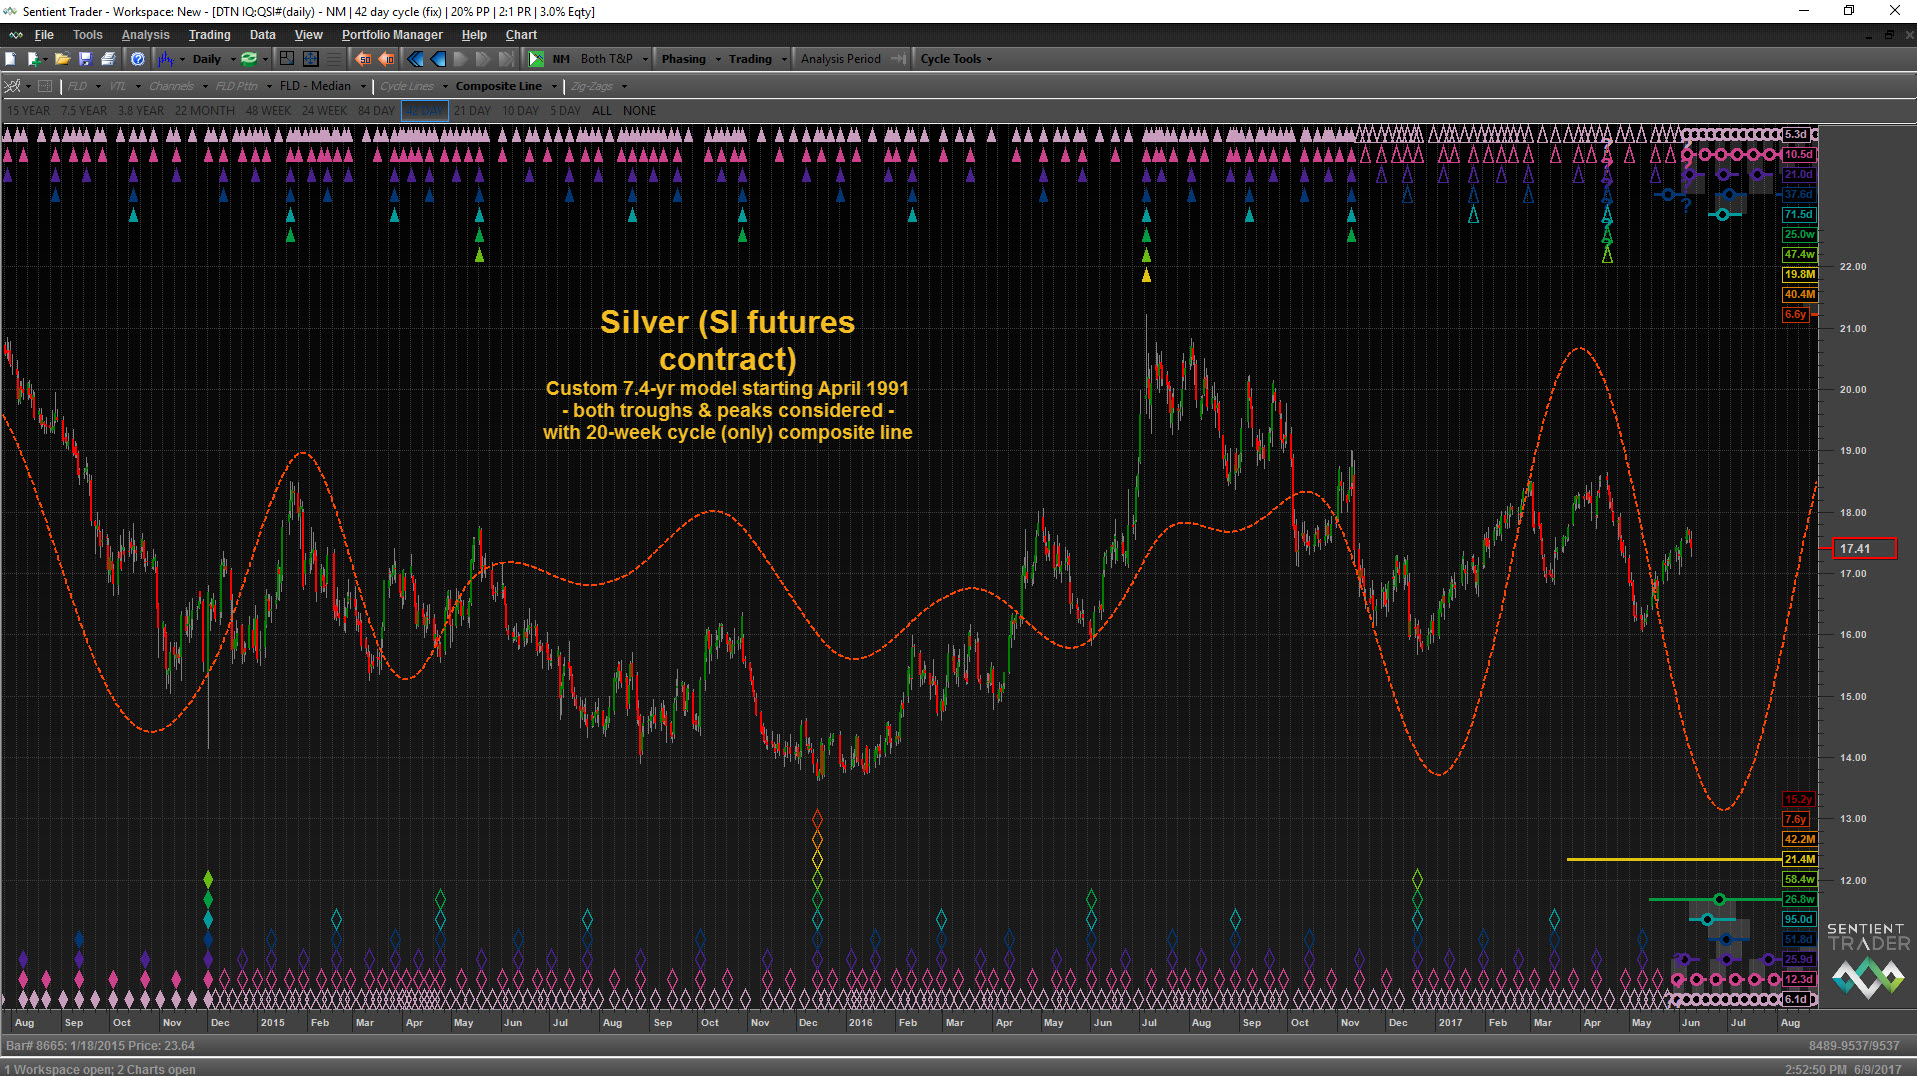
I believe that this powerful trifecta of charts shows in a nutshell why I utilize Hurst cycle analysis as a required companion to my Elliott Wave counts and associated Fibonacci targets! The combination is very strong in its predictive powers. But that’s not all I look at:
NEW!: In addition to Hurst and Elliott, my analysis for subscribers heavily considers trader sentiment, especially DSI (retail trader positioning), as retail traders are reliably wrong en masse at major market turns. I show DSI chart indicators on more that two dozen tradeable items during every weekly “Counts” webinar. Finally, I’ve recently added showing pro-plan subscribers how auto-trading algos are likely positioned currently because much of the trading volume these days comes from automated systems. I think it’s very important to stay aware of how most trading algorithms are currently viewing the markets.
The bottom line: If you haven’t subscribed to one of my paid services lately, there’s a lot of new stuff going on, and it’s good. You should give my services a try.
– Sid (ElliottWavePlus.com)
P.S. This testimonial just came in today (June 9, 2017): “Good morning Sid. Once again . . . . great call in your webinars! I just liquidated longs in the S&P and Russell, and liquidated my shorts in Natural Gas and initiated longs in Sugar on Monday ~ per your DSI numbers and EW/Hurst analysis. Thanks again for all you do. Pretty awesome!!! – Deb