The Stock Market Is Entering 2023 At A Critical Juncture
Summary
- There is a cluster of three large-degree Fibonacci targets that suggest that the Dow Jones Industrial Average has not completed 5-waves up from the 1932, 1974 & 2009 lows yet.
- The March 2020 low was an intermediate-degree (black) wave 4 low. There are two potential ways the market can finish a 5-wave structure up from that low.
- Shorter-term, I’ve been tracking three potential wave counts for the S&P-500. The market could eliminate up to two of those counts during the first few weeks of the new year.
- Our method of combining Elliott wave and its associated Fibonacci price targets, Hurst cycle analysis, sentiment extremes, momentum, volume signatures and more provide higher confidence trading forecasts than Elliott wave theory when used alone.
Our Long-Term Wave Count for the Dow Jones Industrial Average Includes a Cluster of Fibonacci Targets that Haven’t Been Hit Yet.
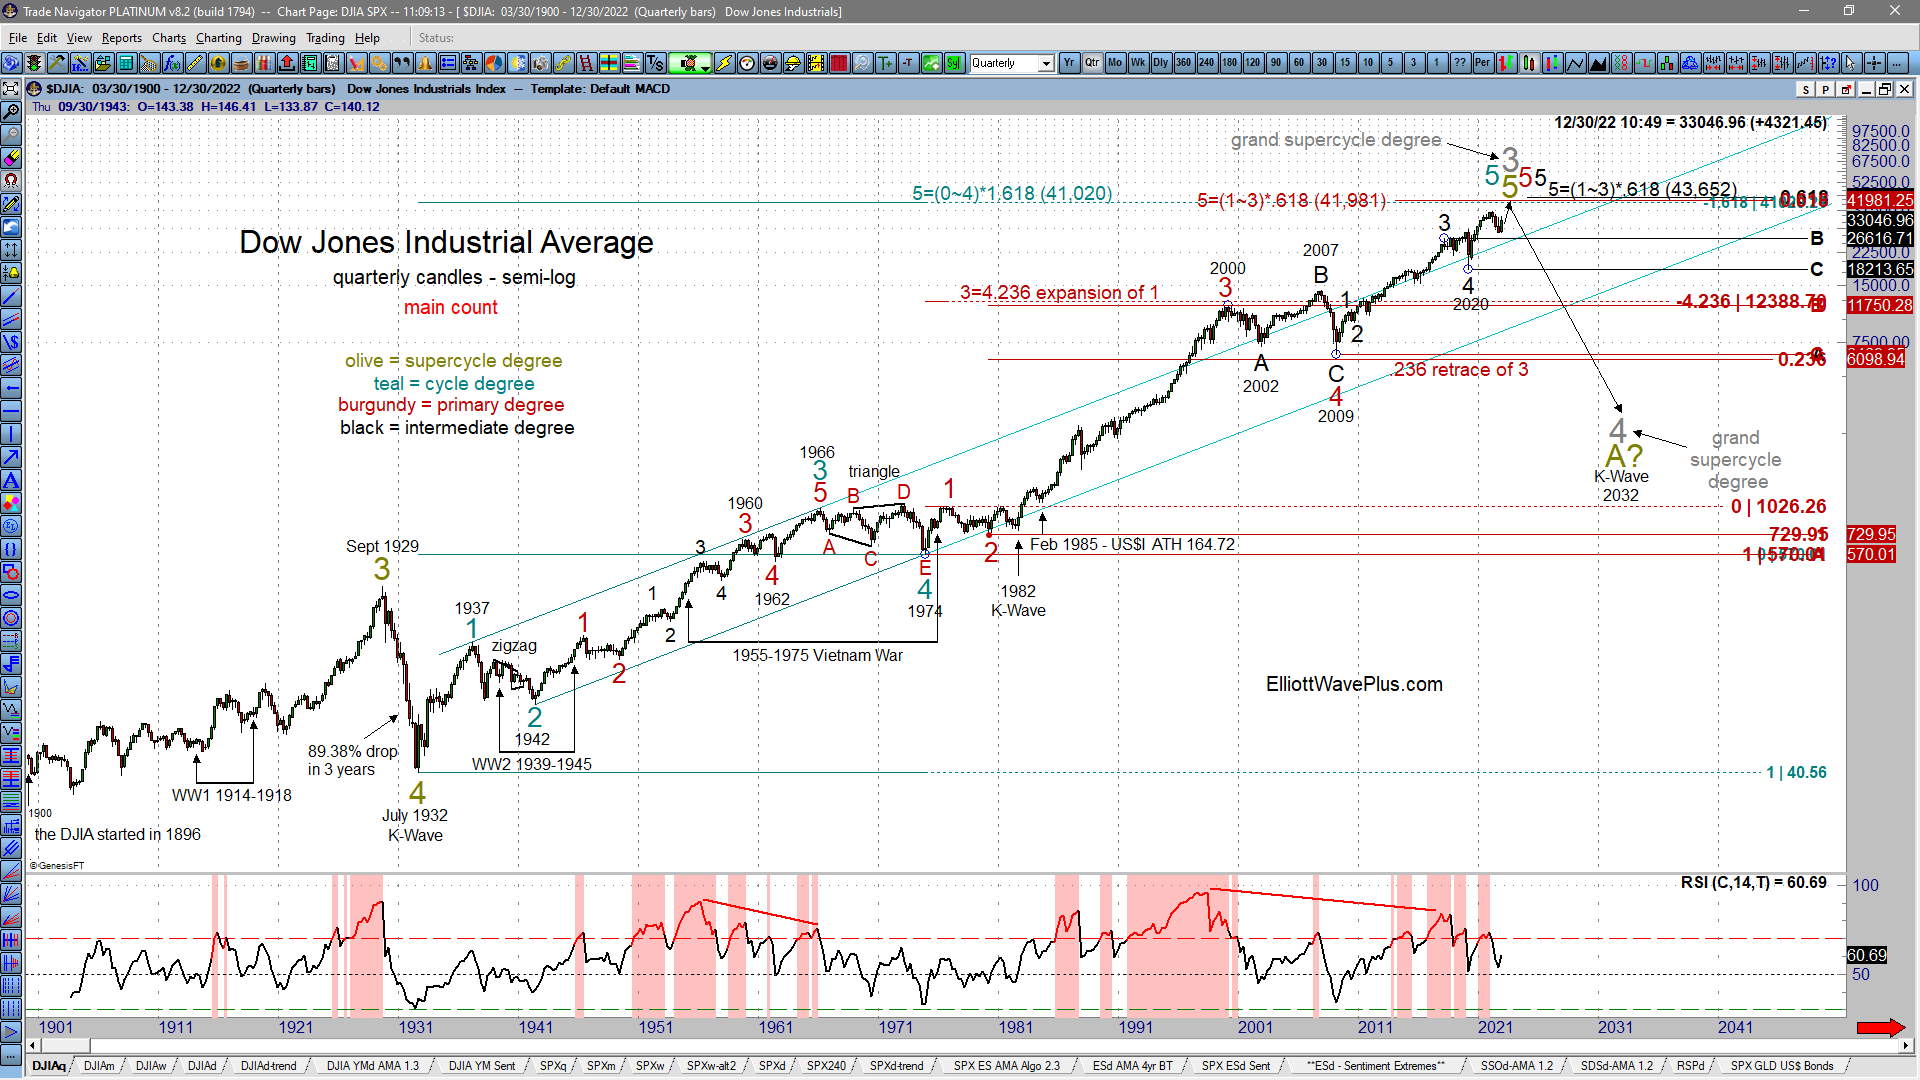
Our long-time wave count and associated Fibonacci price targets for the Dow Jones Industrial Average is shown below:
(click on images to enlarge)
Notice the cluster of Fibonacci price targets at 41,020, 44,981 and 43,652. At 41,020, the teal (cycle-degree) wave 5 up from the 1974 low will equal 1.618 times the distance from the 1932 low to the 1974 low. In other words, when the extremely extended cycle-degree wave five up from the 1974 low hits 41,020, the 1974 low will cut the entire move up from the 1932 low by the golden section.
Within the teal (cycle-degree) fifth wave up from the 1974 low, there are five clear burgundy (primary-degree) subdivisions. Burgundy wave five has been underway to the upside since the 2009 low. The most reliable target for the end of a fifth wave in Elliott wave is where wave five is equal to the net travelled by waves one through three times .618. In this case, the target for the end of Burgundy wave five is 41,981.
Please note that the quarterly chart of the Dow Jones Industrial Average above is shown using semi-log scale. Also, my platform (Genesis Trade Navigator) allows for its Fibonacci tools to utilize semi-log math. Very few consumer platforms include semi-log Fib tools, so you may not be able to duplicate these targets on your own platform. I use semi-log charts and Fib tools on all chart timeframes.
Finally, the third Fibonacci target at 43,652 is where black (intermediate degree) wave five would equal the net travelled of black waves one through three times .618. This is the most reliable Fibonacci target for the end of the five waves up from the March 2009 low.
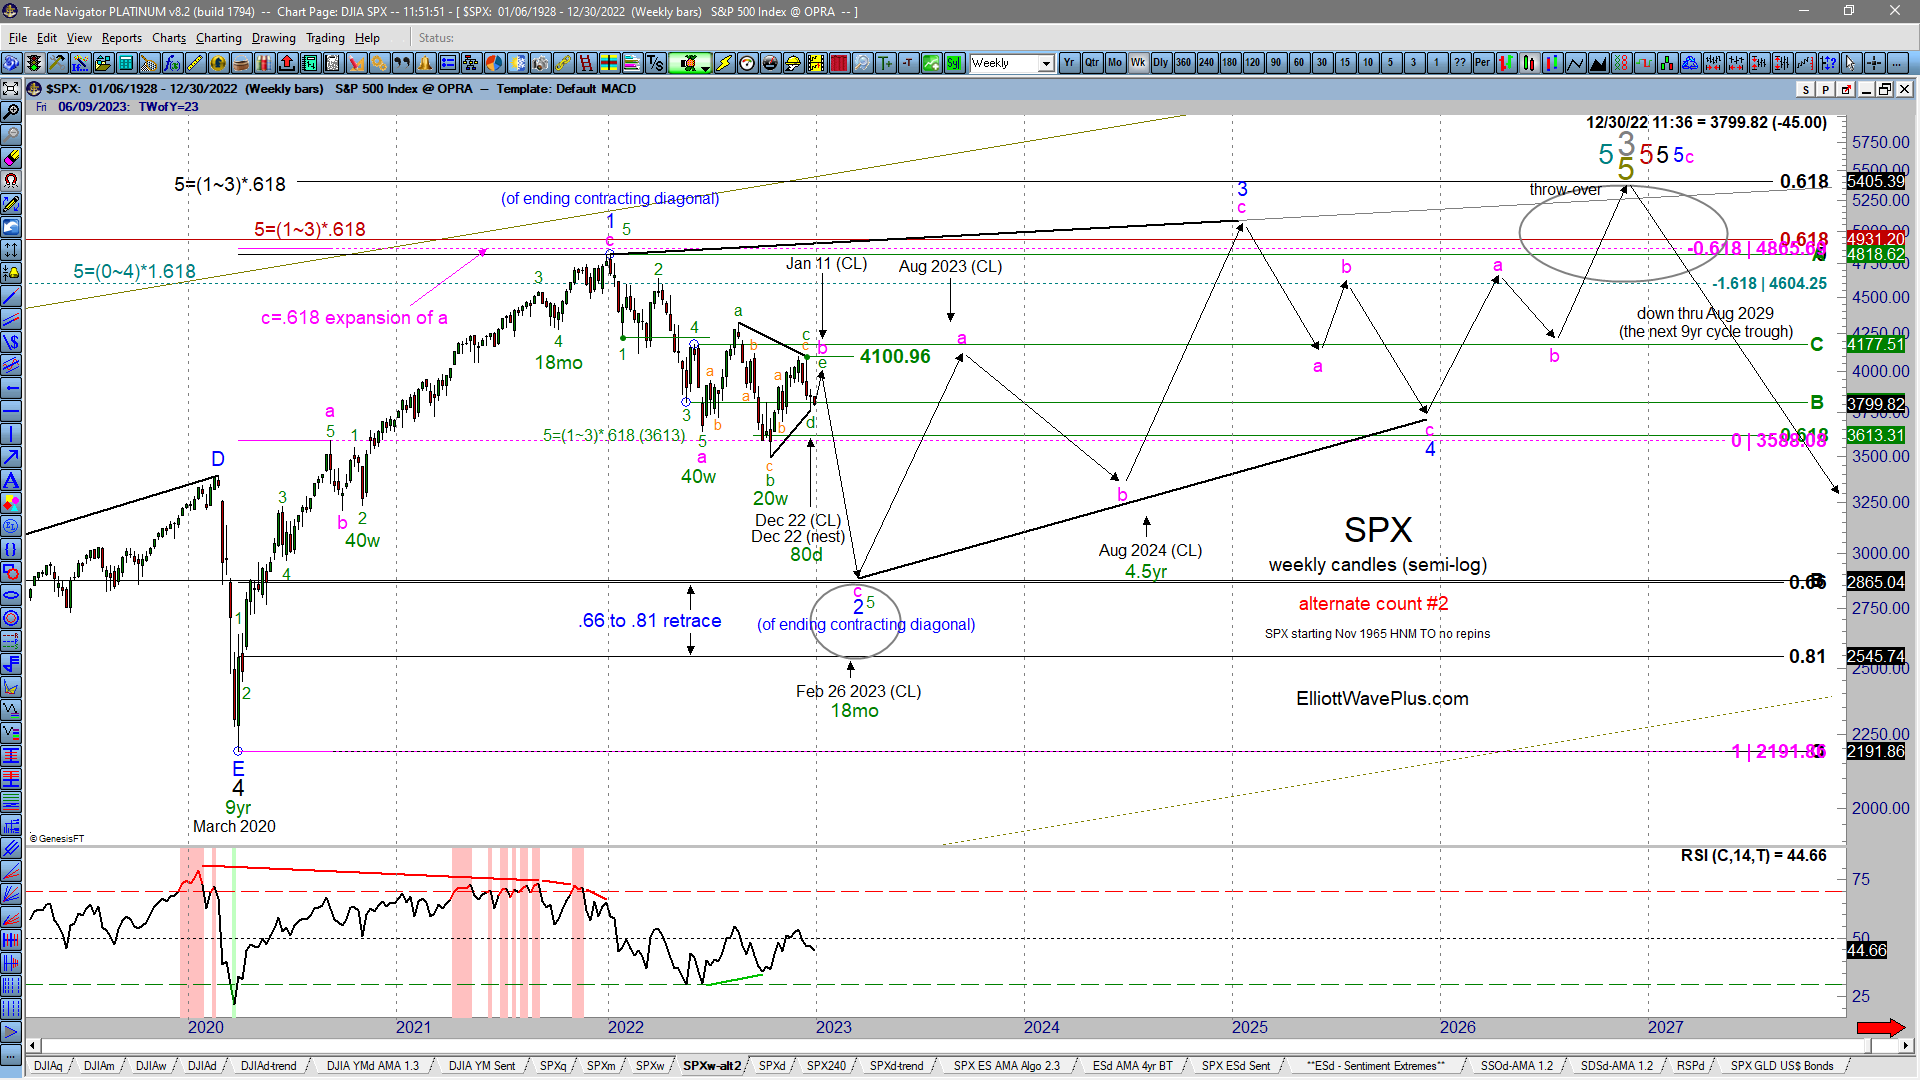
Up from the March 2020 low, the stock market needs to complete five waves up. It hasn’t done that yet.
Below are our weekly charts of SPX (the S&P-500). Notice that each chart includes both an Elliott wave count and Hurst cycle analysis dates, as well as indications of RSI divergence. The first chart is my main count which expects that a five-wave non-overlapping impulse to the upside from the March 2020 low is incomplete. The second is my alternate count, which expects that a longer-lasting five-wave ending contracting diagonal began at the March 2020 low and will require several more years to complete.

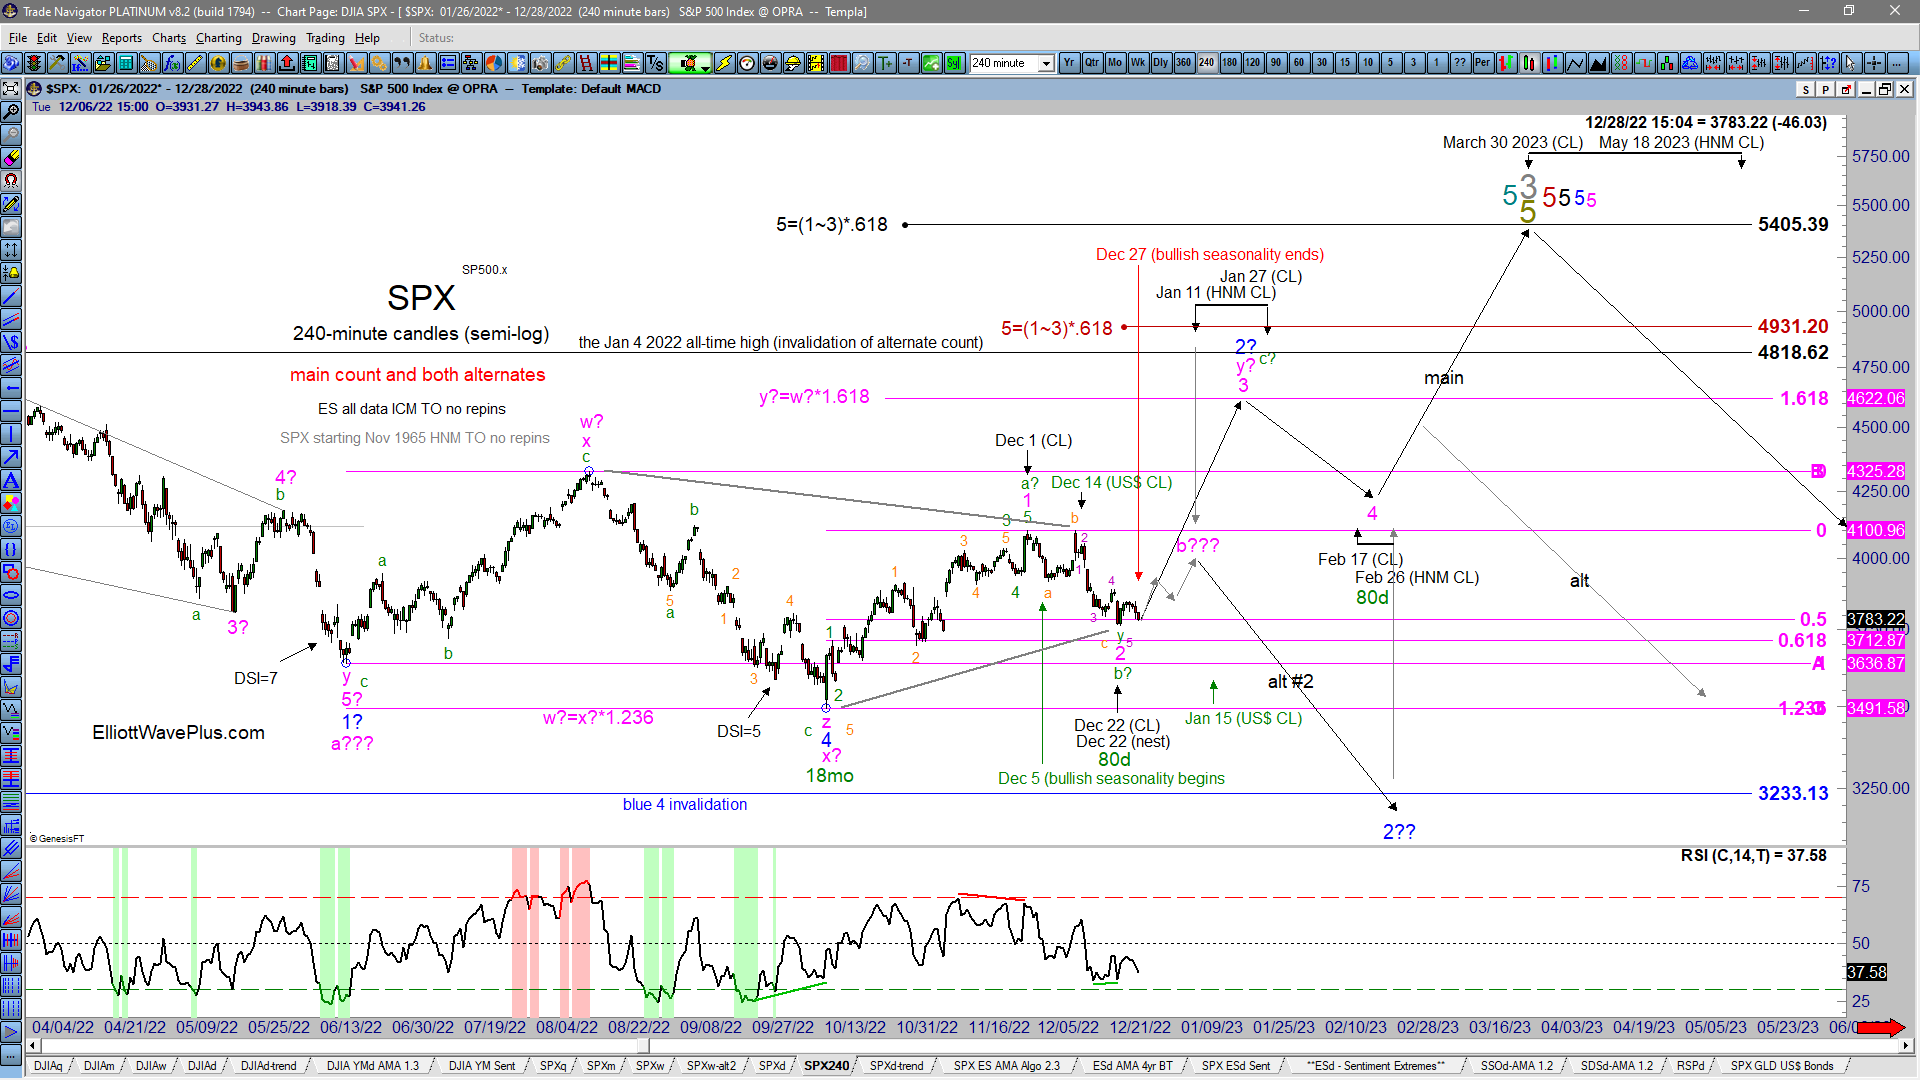
Shorter-term, I’m showing three potential wave counts on the S&P. The market is at an important juncture where one or more of those wave counts are likely to be eliminated within a few short weeks.
See the 240-minute chart below, which includes Hurst cycle analysis projected turn dates using two different cyclic models. Notice the date range topping and bottoming “windows” shown on the chart. Producing Elliott wave counts that work in harmony with these cyclic timing windows is one of the most important things we do here at ElliottWavePlus.com, and it sets us apart from our competitors.
We don’t rely exclusively on the combination of Elliott wave, Fibonacci targets, and Hurst cycle analysis. We go the extra mile by comparing Retail vs. Commercials Sentiment, as well as Money Flow (Volume) vs. RSI on daily charts for our subscribers to assist in timing the swings.
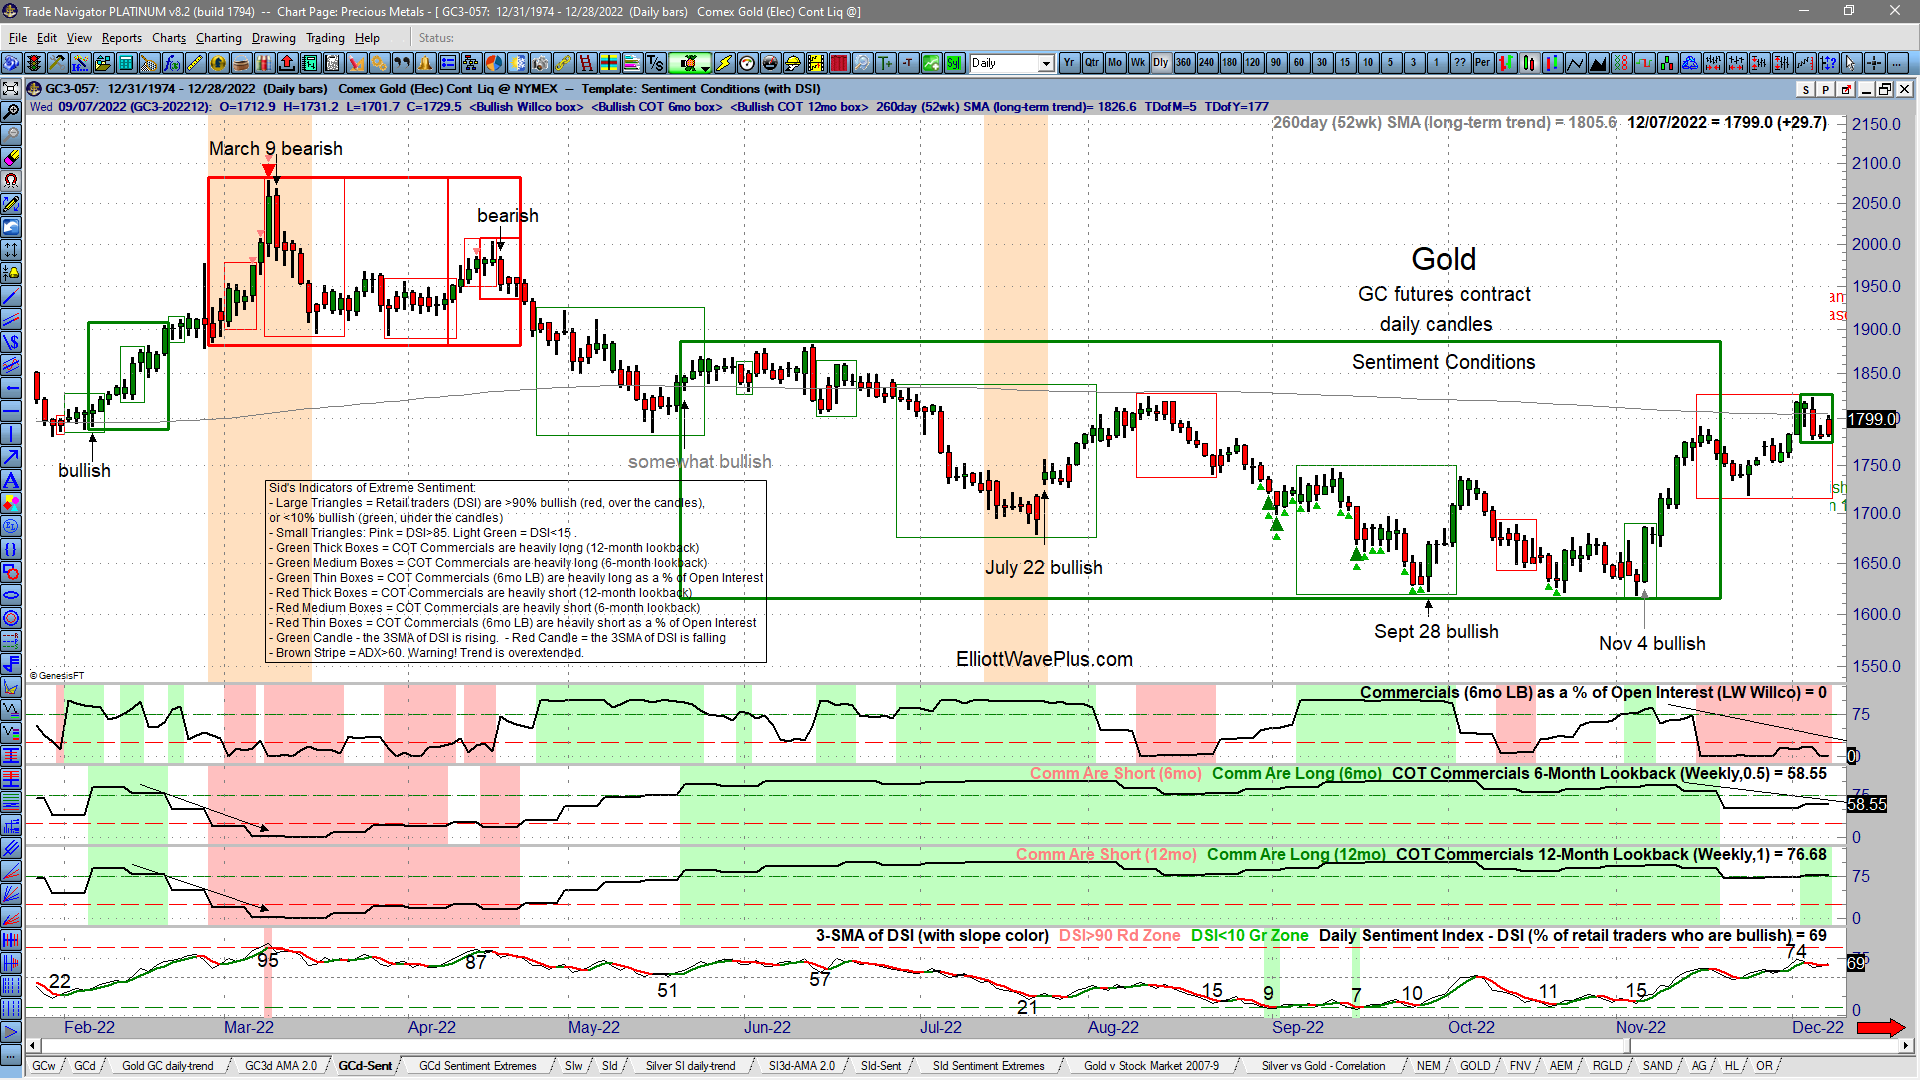
The Gold chart below shows how valuable our Commercials vs. Retail “Sentiment Conditions” screenshots have been to our subscribers over the past year. When Commercials (the producers) are heavily long on all three measures (short, intermediate, and longer term), they are positioned for a rally. When bullish Commercials positioning coincides with extreme Retail bearishness, we call that a “perfect storm” of bullishness. Vice versa works just as well.
The XLE chart below shows how important our custom Money Flow vs. RSI indicator can be to traders. Along the bottom of the screenshot, when the blue line is above the black line and both are rising from a green stripe area, there is strong buying volume supporting the rally from deep oversold territory.
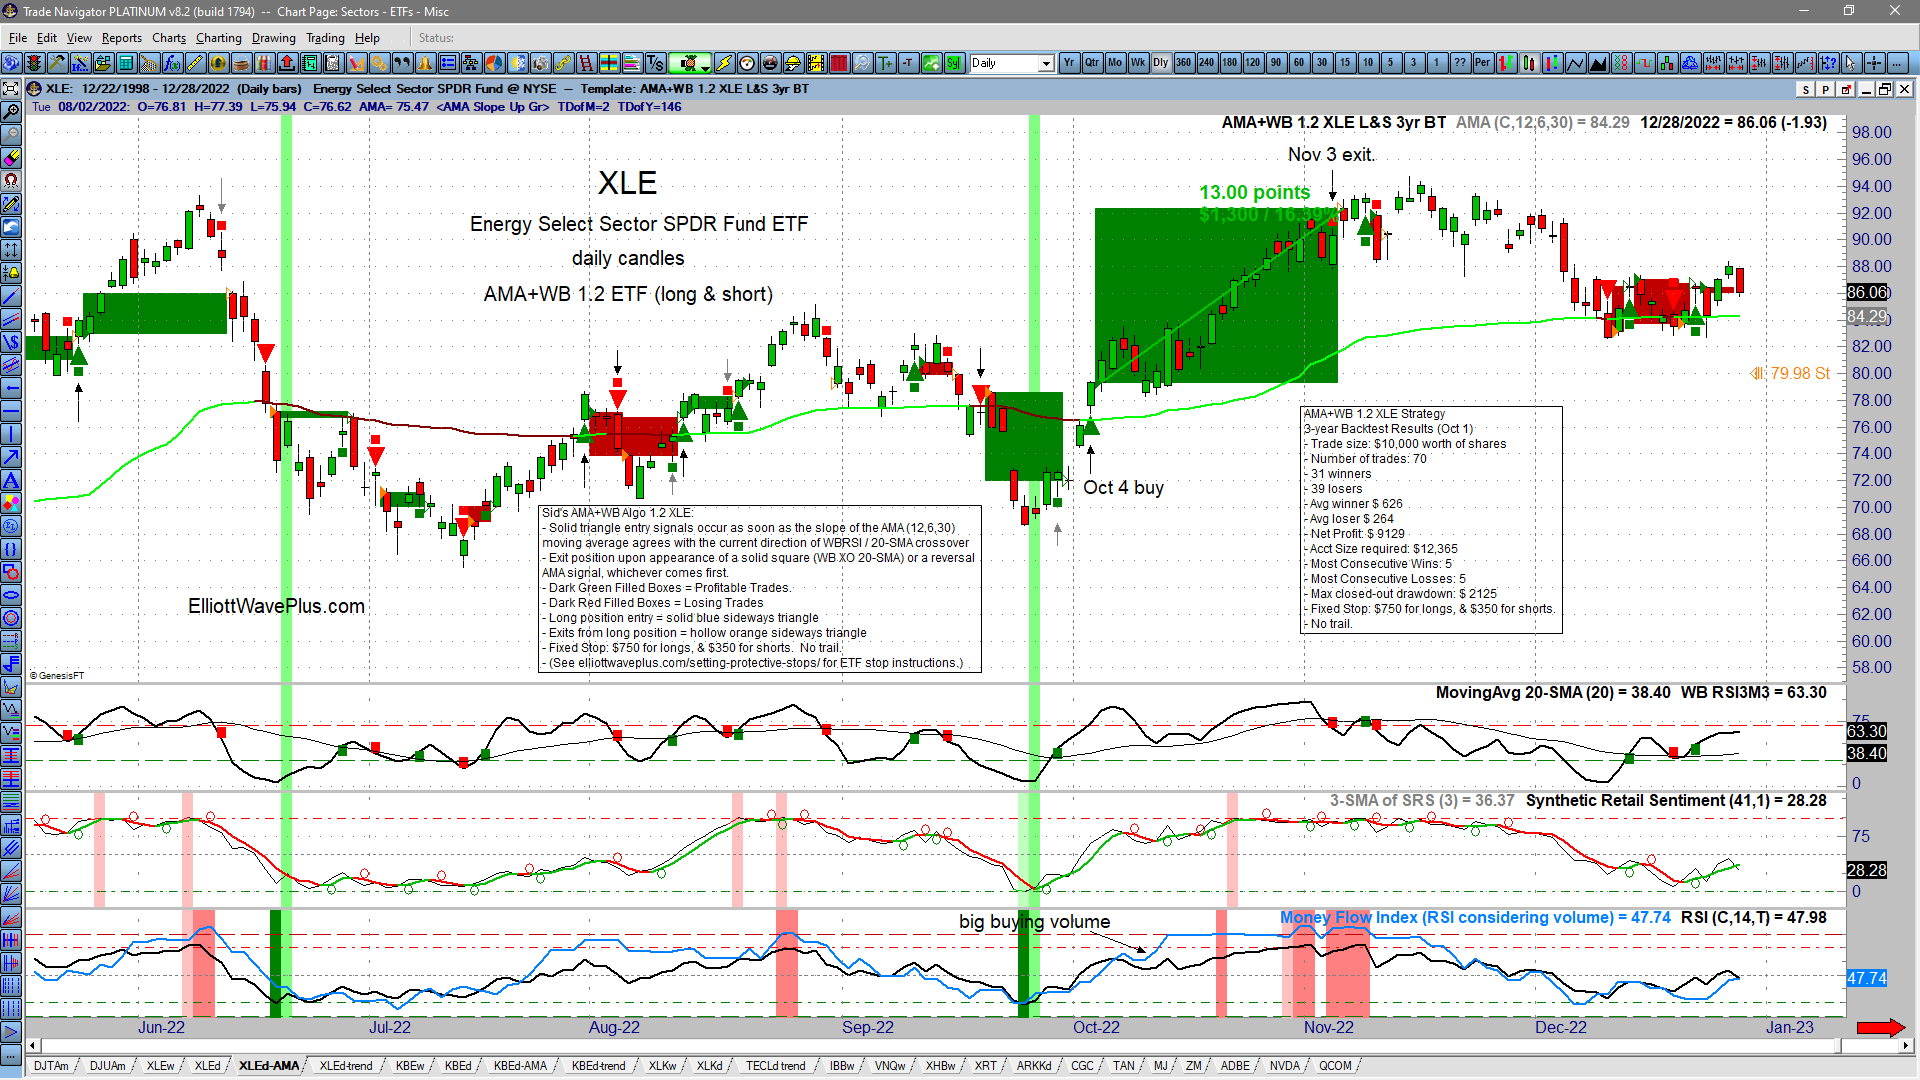
The screenshot above is our proprietary momentum algo for our Premium Plan subscribers. It shows actual trade signals that were provided to subscribers in real time during Q4 2022. The large green boxes represent winning trades, the small dark red boxes show the losing trades. For example, our Premium Plan nightly report on October 4 said buy XLE at market at the open the next day. It also suggested where to place a protective stop.
XLE rallied strongly until the algo, which sticks with trending moves until there is a measurable loss of momentum, signaled to exit the trade after the close on November 3. Our subscribers were provided with a tremendously profitable trading opportunity. Had they invested $10,000 in XLE at the market open on October 5 and closed the trade at the market open on November 4, they would have turned their $10K into $11,300, a gain of 16.39% in the span of 22 trading days.
Check out our website and service offerings at ElliottWavePlus.com! Thanks for reading.
—-
Our System
Over the years, we’ve found several methods of technical analysis to be worthy of constant consideration when trading. This combination of robust forms of technical analysis creates an integrated approach to trading that is more powerful than Elliott Wave theory analysis alone. Our analysis combines:
- ELLIOTT WAVE (W/ FIBONACCI PRICE TARGETS)
- HURST CYCLE ANALYSIS
- EXTREME SENTIMENT POSITIONING
- INTER-MARKET CORRELATIONS
- MULTI-TIMEFRAME DIVERGENCES
- SEASONALITY
- ALGORITHMIC TRADE SIGNALS
Subscriptions
We offer four subscription levels. The Premium Plan includes everything we do including daily momentum algo trade signals on over twenty items, as well as daily screenshots of our proprietary Sentiment Conditions template. The Pro and Premium plans include future roadmaps based on a combination of Elliott Wave and Hurst Cycles, as well as a “live” weekly Counts webinar. The Basic Plan includes the Elliott wave + Hurst cycles screenshots only (twice-per-week), but no weekly webinar. The entry level Trend Plan offers daily trend analysis (but no Elliott Wave or Hurst) on many popular items, plus momentum algo signals on Cryptos.
Our unique approach is well worth consideration, especially if you’ve never experienced wave labeling and associated Fibonacci price targets that are derived in harmony with independent Hurst cycle analysis. Here’s more info about subscribing.
An overview of our pricing can be found here.
Be sure to subscribe at our YouTube channel.
Follow us on Twitter
Follow us on Facebook
(There is risk of loss in all trading. See the full disclaimer at our site.)
Testimonials
“Hi Sid…I’ve been looking for an excuse for a while to pay you a well-deserved compliment. I find your insight on the markets to be SPOT ON and continue to make good money following your expert guidance. Just recently retiring myself, I feel confident that my nest egg is safe and in position to grow (exponentially) with your guidance. I’ve tried a lot of trading services in the past and find you to be an exception to ALL of them in quality of material, integrity and transparency, and feel no reason to ever look elsewhere.” – K.B.
“One of the traders in my group told me she attended and loved your webinar! She has been spending time reviewing my notes and saved screen shots from previous EWP webinars and comparing them to my past trades made during the week following online seminar. Her comment to me today: EWP at first glance, appears to be too good to be true. But after reviewing the successful trades you made based on EWP, it becomes even more unbelievable!” – W.H.
Click here for way more testimonials spanning the last ten plus years.