Thoughts On the Current State of the Stock Market (and other stuff) – A blog post by Sid Norris from ElliottWavePlus.com
The Other Stuff First:
My programmers tell me that blogging is essential to achieving a high Google rank. Frankly, I spend almost zero time on marketing. Maybe I’m naïve, but I’ve always figured that if my forecasts are right about the markets more than the other guys, the number of paying subscribers at my site will grow organically. And that’s exactly what has happened. The number of paying subscribers at ElliottWavePlus.com, and before that ElliottWavePledictions.com has grown steadily over the years, so I’d like to thank my growing core of loyal subscribers! Without you guys, I wouldn’t be able to continue to improve my work, and the improvements have been coming in droves the past couple of years with the addition and refinement of Sentiment, Divergence, and Trend-Following Algo charts and signals.
Unfortunately, my largest competitors blog every day, blast emails every day, advertise widely on the net, and scheme to have as many google listings as possible on the first page(s) of searches, so competitors will get pushed down in rank. Neat. So here I am, writing another blog post in an attempt to stay at least on the 2nd or 3rd page of searches, which takes time away from analysis work. I’ll try to make it interesting for you.
Thoughts on the Current State of the Markets:
Here we are in mid-November 2017, and the stock market is still going up from the March 2009 low, and commodities, after crashing from 2011 through 2015, are still way off their 2011 highs. To me the most important question at hand continues to be: if commodities start rallying more aggressively, can stocks put in a substantial correction at the same time?
As many of you know, I use Hurst cycle analysis extensively in my work. I sort of marry Hurst and Elliott Wave, so the projection (forecast) moving forward makes sense in BOTH of those seemingly dissimilar worlds. I’ve come to trust Hurst cycle analysis, although sometimes, Hurst’s original nominal model, which was originally created based only on movements in stocks, must be altered to provide accurate and useable analysis in certain commodities markets today (like metals).
Without further ado, here are the current Hurst projections on several items of interest:
- US Stock Market: a major top in late 2017 is expected, to be followed by an ABC correction through the year 2024. (And no, I didn’t label the November 7 high THE top yet like those super-blogging, daily email-blasting, Google search manipulators! (-:) From an Elliott Wave perspective, the 5-wave impulse up from the March 2009 low is likely to end soon, though. That bull market will have lasted about 8.5 years, so even if the 2009-2017 bull was a very bullish Cycle-degree wave 1 (my main count), a multi-year (Cycle-degree) correction would be next. Please note that a Hurst analysis expects a top in the Asian and European markets in March 2018, so the US markets could put in a double top at that time.
- Asian Stock Markets: a major blow-off top is due to end in March 2018 (Hurst), completing a terminal Elliott Wave pattern that started back in 1998. From an Elliott Wave perspective, that top would be followed by a multi-year bear market/crash.
- European Stock Markets: A major top is expected in March 2018. A multi-year bear market should follow.
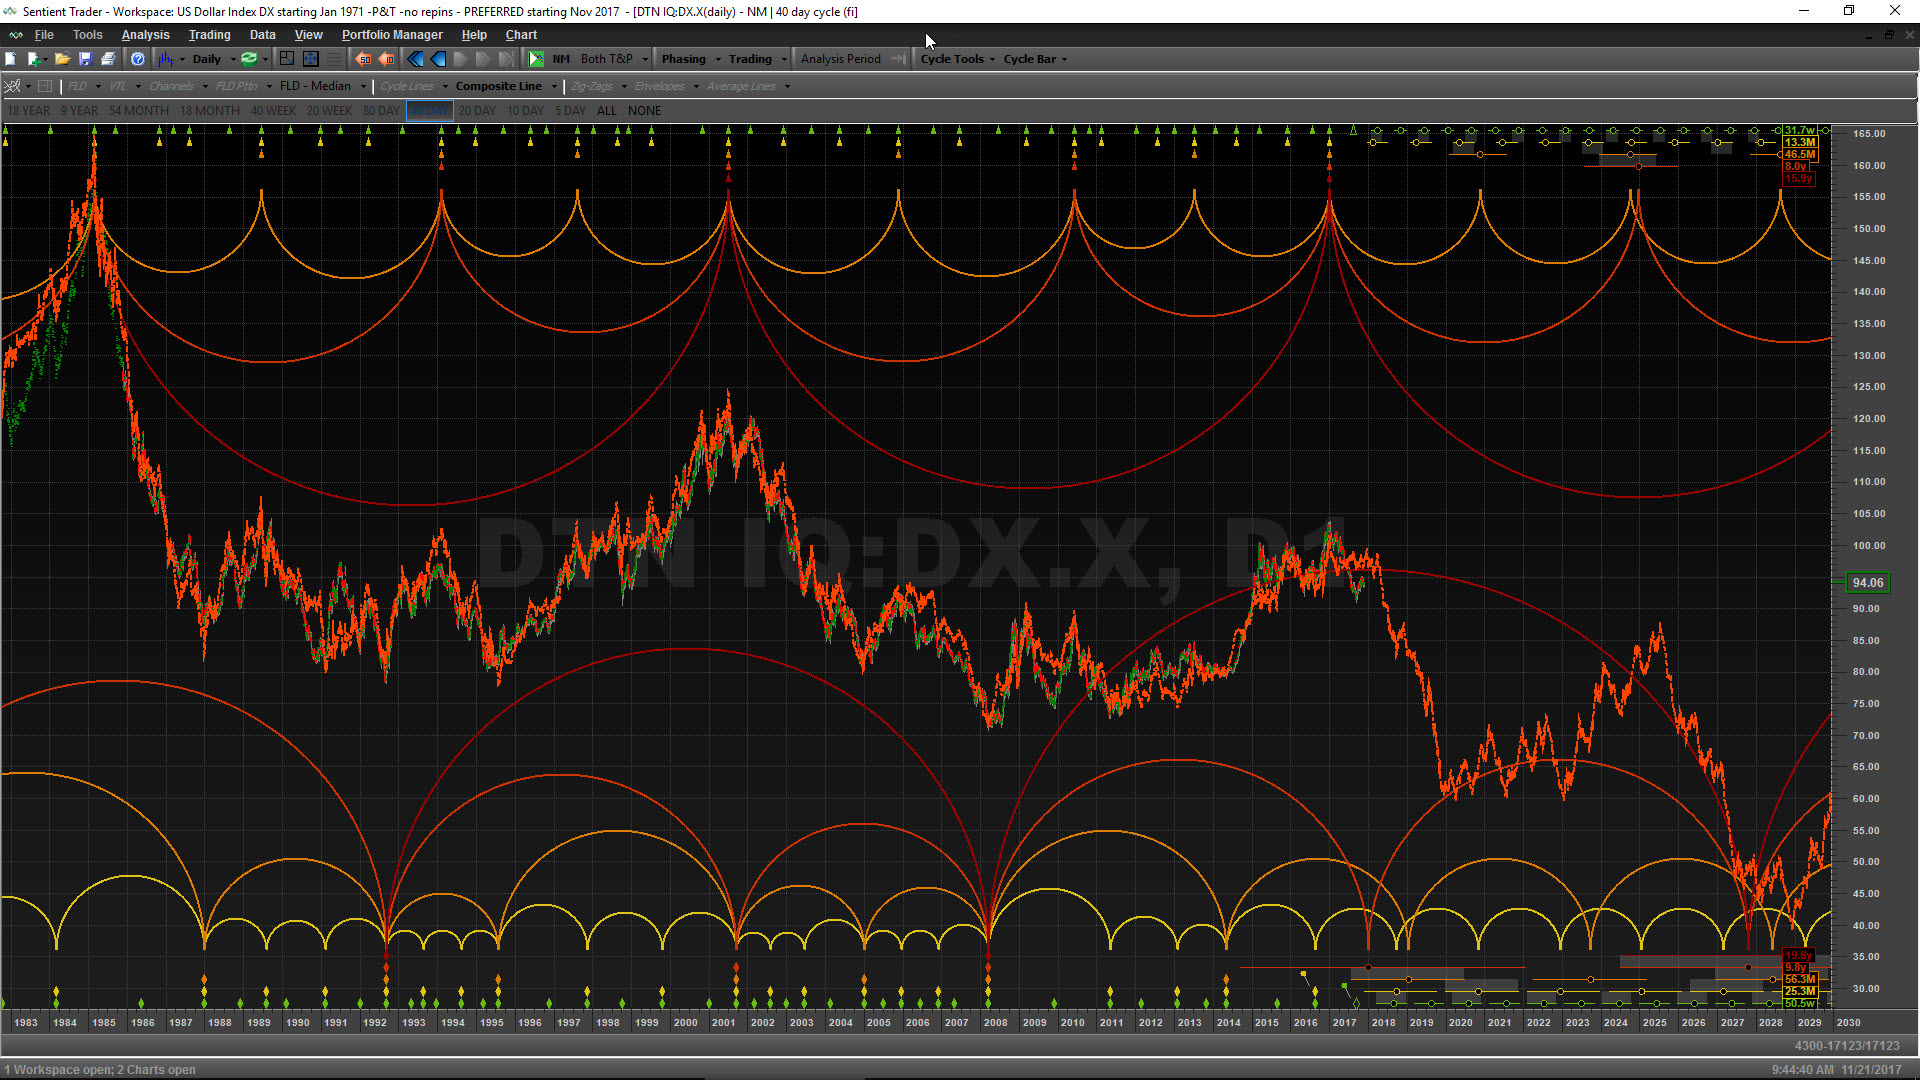
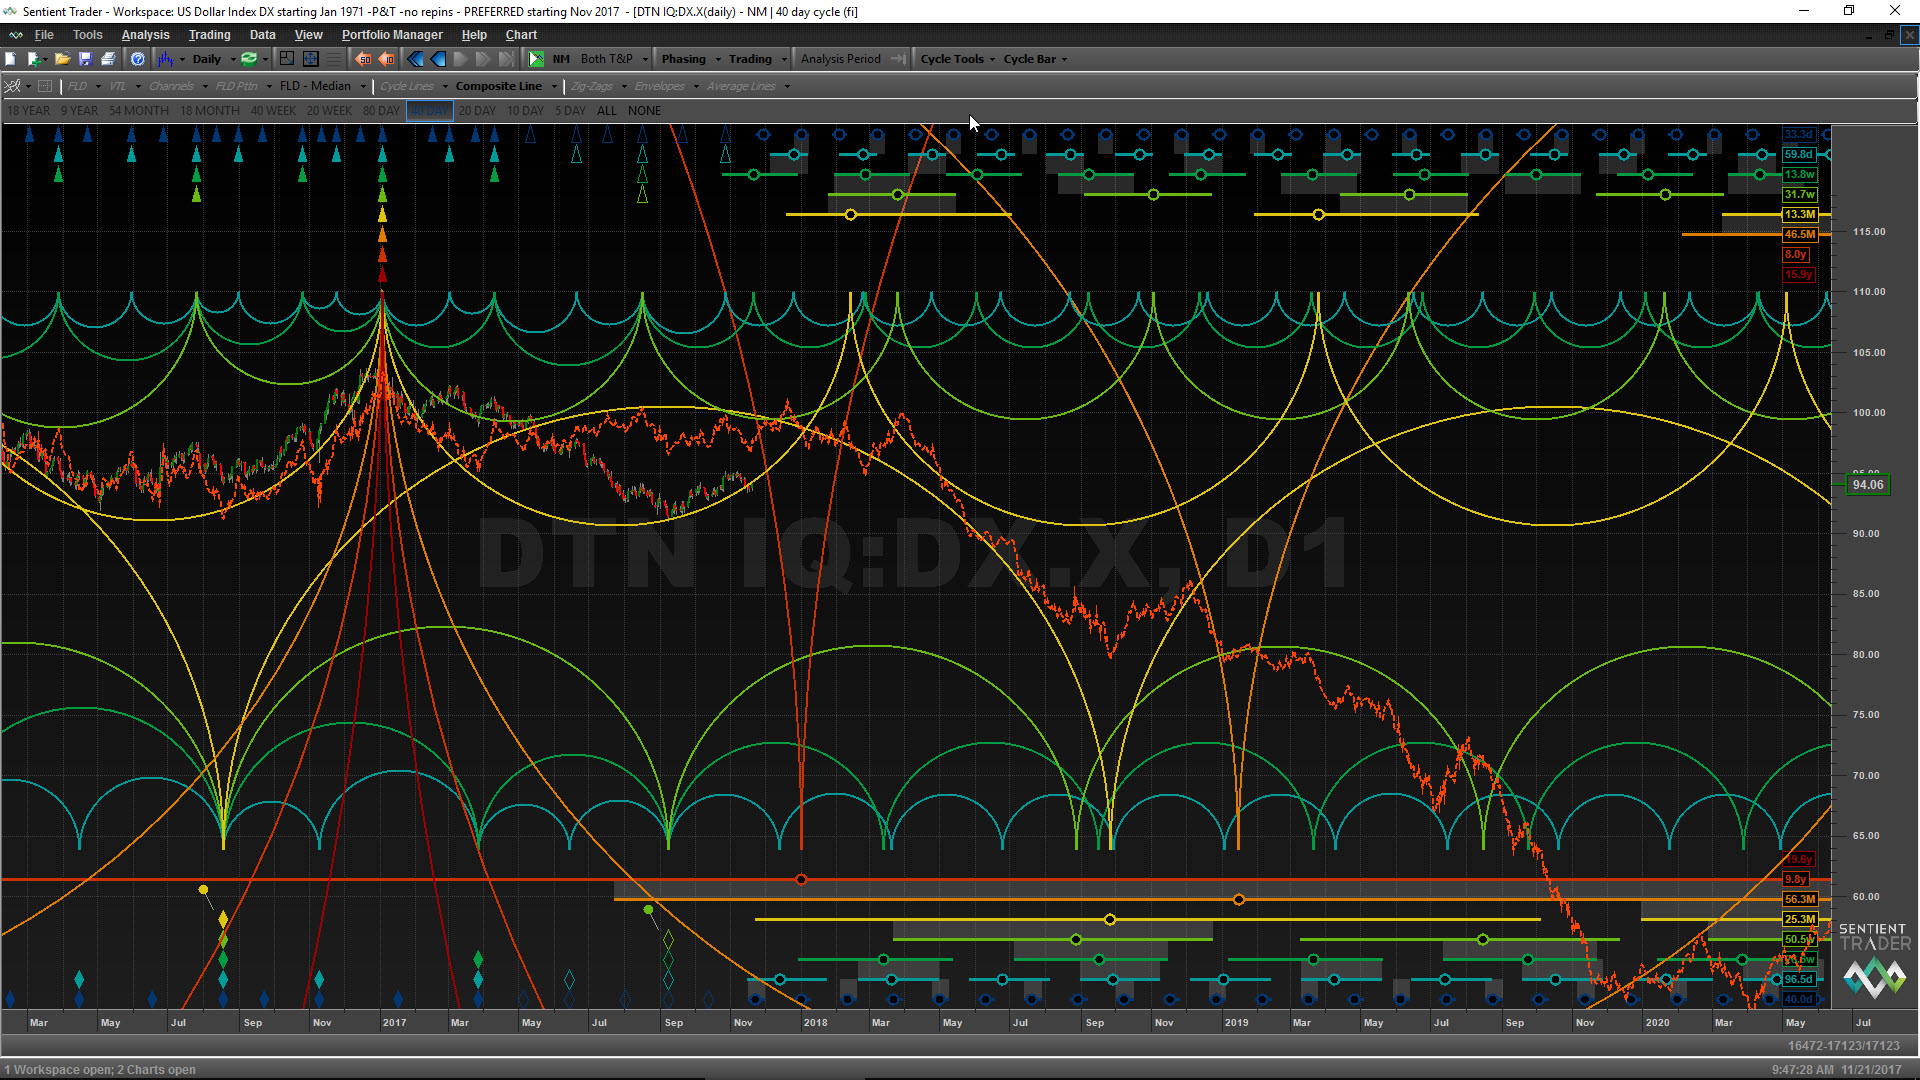
- The US Dollar Index: a major top occurred in January 2017, and a large-degree downtrend is underway, projected to continue through the year 2028. The current up-swing that started in September 2017 should continue correctively through about year-end 2017. Strong downwards movement is currently due to re-engage in late March 2018. (see charts below)
- Crude Oil: A major low occurred in Feb 2016. However, despite the recent “breakout” to levels not seen since mid-2015, Oil will top very soon, and will generally continue to “base” through mid-2020.
- Gold: A major low occurred in December 2015. The sideways chop of 2017 is due to end about year-end, and 2018 should be a very good year for Gold. A custom 7.4-yr 2:1-ratio cyclic model of gold (using Sentient Trader software) projects a continued bull market in gold through the year 2028.
So getting back to the original question: Can commodities rally while stocks crash? For the most part, I would say no, with one exception: Gold/Precious Metals. If stocks are not doing well, the economy is likely suffering, and the demand for industrial-use commodities is likely to suffer along with it. So with stocks due for a significant correction, Crude Oil (which already crashed), will continue to base, the US dollar will weaken with the economy, and Gold, which usually rallies with inflation, will rally this time in a flight to safety, not to mention a weakening Dollar. Did I come to these conclusions because I’m a raging gold-bug? Nope. I don’t care what goes up and what goes down. I just want to be on the right side of the trade! These conclusions were reached based on a combination of computer-generated Hurst analysis and an Elliott Wave roadmap that matches up fairly well to the Hurst. This method largely eliminates opinion and bias from my analysis. Elliott Wave, when used alone, invites opinion and bias. It’s human nature. And many tendencies that go hand-in-hand with human nature (like herding, for example) MUST be avoided if successful trading of the markets is the goal.
What good is a blog post without some nice pictures to look at? Below are several screenshots of recent long-term (starting Jan 1971) Hurst cycle analysis on the US Dollar Index. The Sentient Trader software orange “composite line” shows the general forward projection for the future direction of price. Please note that the composite line does not suggest PRICE, only DIRECTION. Also, please be advised that Hurst analysis can and does morph gradually over time, constantly adjusting the projected date ranges of future peaks and troughs at all degrees based on ongoing price action. All ElliottWavePlus.com paid subscribers are made aware of these gradual changes on a constant basis, especially if the roadmap morphs substantially, like a large degree trough forming early, like it did in the US stock market in the first quarter of 2016.
Each of the following screenshots provides a progressively closer-up perspective on the projected future price direction of the US Dollar Index, based on a current Hurst analysis starting January 1971. (Click on each chart to enlarge).


I utilize analysis like this on all of the items mentioned above, and many more. Please consider a subscription. There are several levels of service, and a free trial period is included. Thanks for reading.
Sid Norris – ElliottWavePlus.com