[vc_row][vc_column][vc_column_text css=”.vc_custom_1626815796465{margin-bottom: 0px !important;}”]
Thrift Savings Plan | TSP Charts
Weekly Charts Now Available | Video Below
Elliott Wave Plus
Elliott Wave Plus is now providing weekly coverage on TSP funds (Thrift Savings Plan). Investing in TSP funds doesn’t have to be passive. Being aware of each fund’s current condition is critical when trying to decide where to invest. We have started charting the five core funds offered in the Thrift Savings Plan and are including two bonus charts each week to help the TSP participants have a broader picture of the overall market. Every week, Elliott Wave Plus will post these charts to the website under the current Trend Plan subscription. Subscribers will receive everything our Trend Plan has to offer, but will also receive the following…
TSP Fund Charts:
- VOO – Vanguard S&P-500
- VXF – Extended Market Index (small & midsize stocks)
- VEA – Markets around the globe
- BND – Total Bond Market
- VGSH – Short-Term Treasury
Bonus Items Covered:
- DBC PowerShares DB Commodity Index
- US Dollar Index (DX Futures)
Video on TSP Charts:
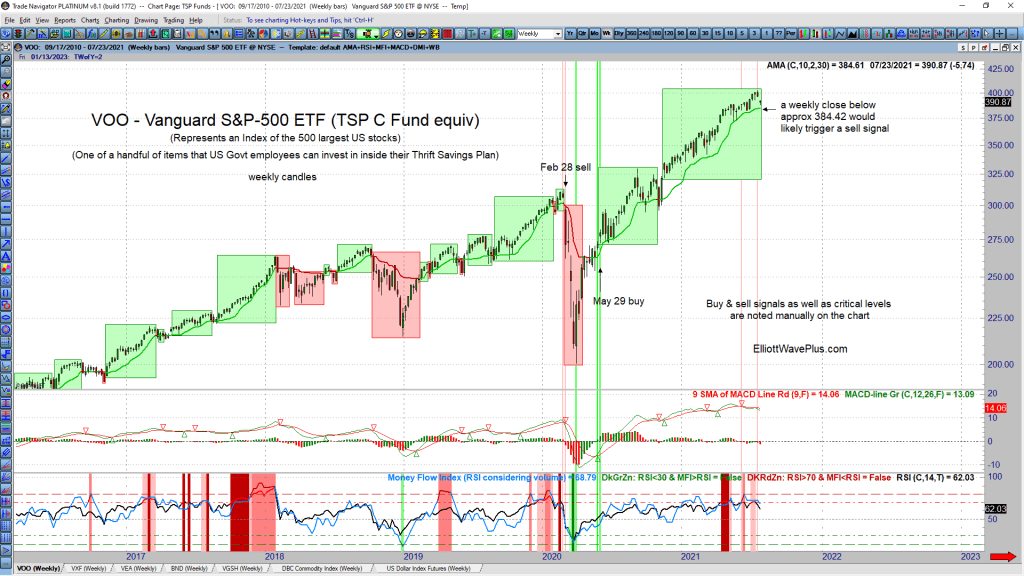
These charts will provide subscribes with tools and useful information regarding their TSP investments. Just like our Trend charts, the TSP charts will contain the Adaptive Moving Average indicator and show traders when there’s a strong “buy” zone or “sell” zone. These zones are clearly visible on the charts, depicted by solid green or red boxes around the price action.
Here’s an example of VOO – Vanguard S&P-500 ETF (TSP C Fund equivalent):
Summary:
There are chart notations informing traders of the Funds current condition (based on technical analysis), and early warning signs of a reversal (if applicable). These charts provide an effective, quick glance that traders can use every weekend to make some decision regarding their retirement portfolio. Improving portfolio balancing and timing helps investors avoid those dreaded periods of drawdown. Click this link to see our different subscription levels – subscriptions levels.
– Sid Norris & Andrew Norris
Subscriptions:
We offer a number of subscription levels. Some are mostly about future roadmaps based on a combination of Elliott Wave and Hurst Cycles, and others are based on automated algos. Sid presents his Elliott wave counts, which include integrated Hurst cycle analysis on over one hundred trade-able items for subscribers (Basic Plan & up) every weekend. He sends out updates on the most popular of those items every Wednesday. Crypto and Premium Plan subscribers receive algo screenshots nightly, as described in prior blog posts. Sid’s unique approach is well worth considering, especially if you’ve never experienced wave labeling and associated Fibonacci price targets that are derived in harmony with independent Hurst cycle analysis. Here’s more info about subscribing.
Be sure to subscribe at our YouTube channel.
Follow us on Twitter
Follow us on Facebook
(There is risk of loss in all trading. See the full disclaimer at our site.)
Testimonials:
“Sid, you continue to yield remarkable results – your silver analysis has been nothing short of spectacular this year and I have made enormous profits this year thanks to it. Booked another huge silver profit ( this time short ) based on your perfect analysis. God has blessed you my friend with great wisdom- thanks for sharing it with others !” – J.F
“Sid, Just a quick note from a long-term subscriber to let you know how much I appreciate your work, insight and dedication to excellence. Thank you and regards.” – J.V
Click here for many more testimonials spanning the last ten plus years.[/vc_column_text][/vc_column][/vc_row]

