Trader sentiment, and how we use it to our advantage at Elliott Wave Plus.
Larry Williams is surely one of the greatest traders and trading educators ever. If you are trading the markets now, and haven’t read his book: “Trade Stocks & Commodities with the Insiders – Secrets of the COT Report”, stop trading, get the book, and read it several times over. The material he presents in the book suggests that sentiment positioning may be the single most important driver of price movement, and especially trend changes in the markets.
Please examine the current chart of Copper below. (Click on it to enlarge). The main indicators were inspired by the writings of Larry Williams, specifically the positioning of COT Commercials vs Retail Traders (DSI). Generally, when the big commodity producers (Commercials) are heavily long, and retail traders are simultaneously heavily short, the market is very likely to change trend to the upside fairly soon, (and vice versa). But when will the trend change occur? Williams states that a wide positioning spread between the Producers/Commercials and Retail Traders is a warning signal that conditions are ripe for a turn, but he also suggests that the condition isn’t necessarily a precise timing mechanism.
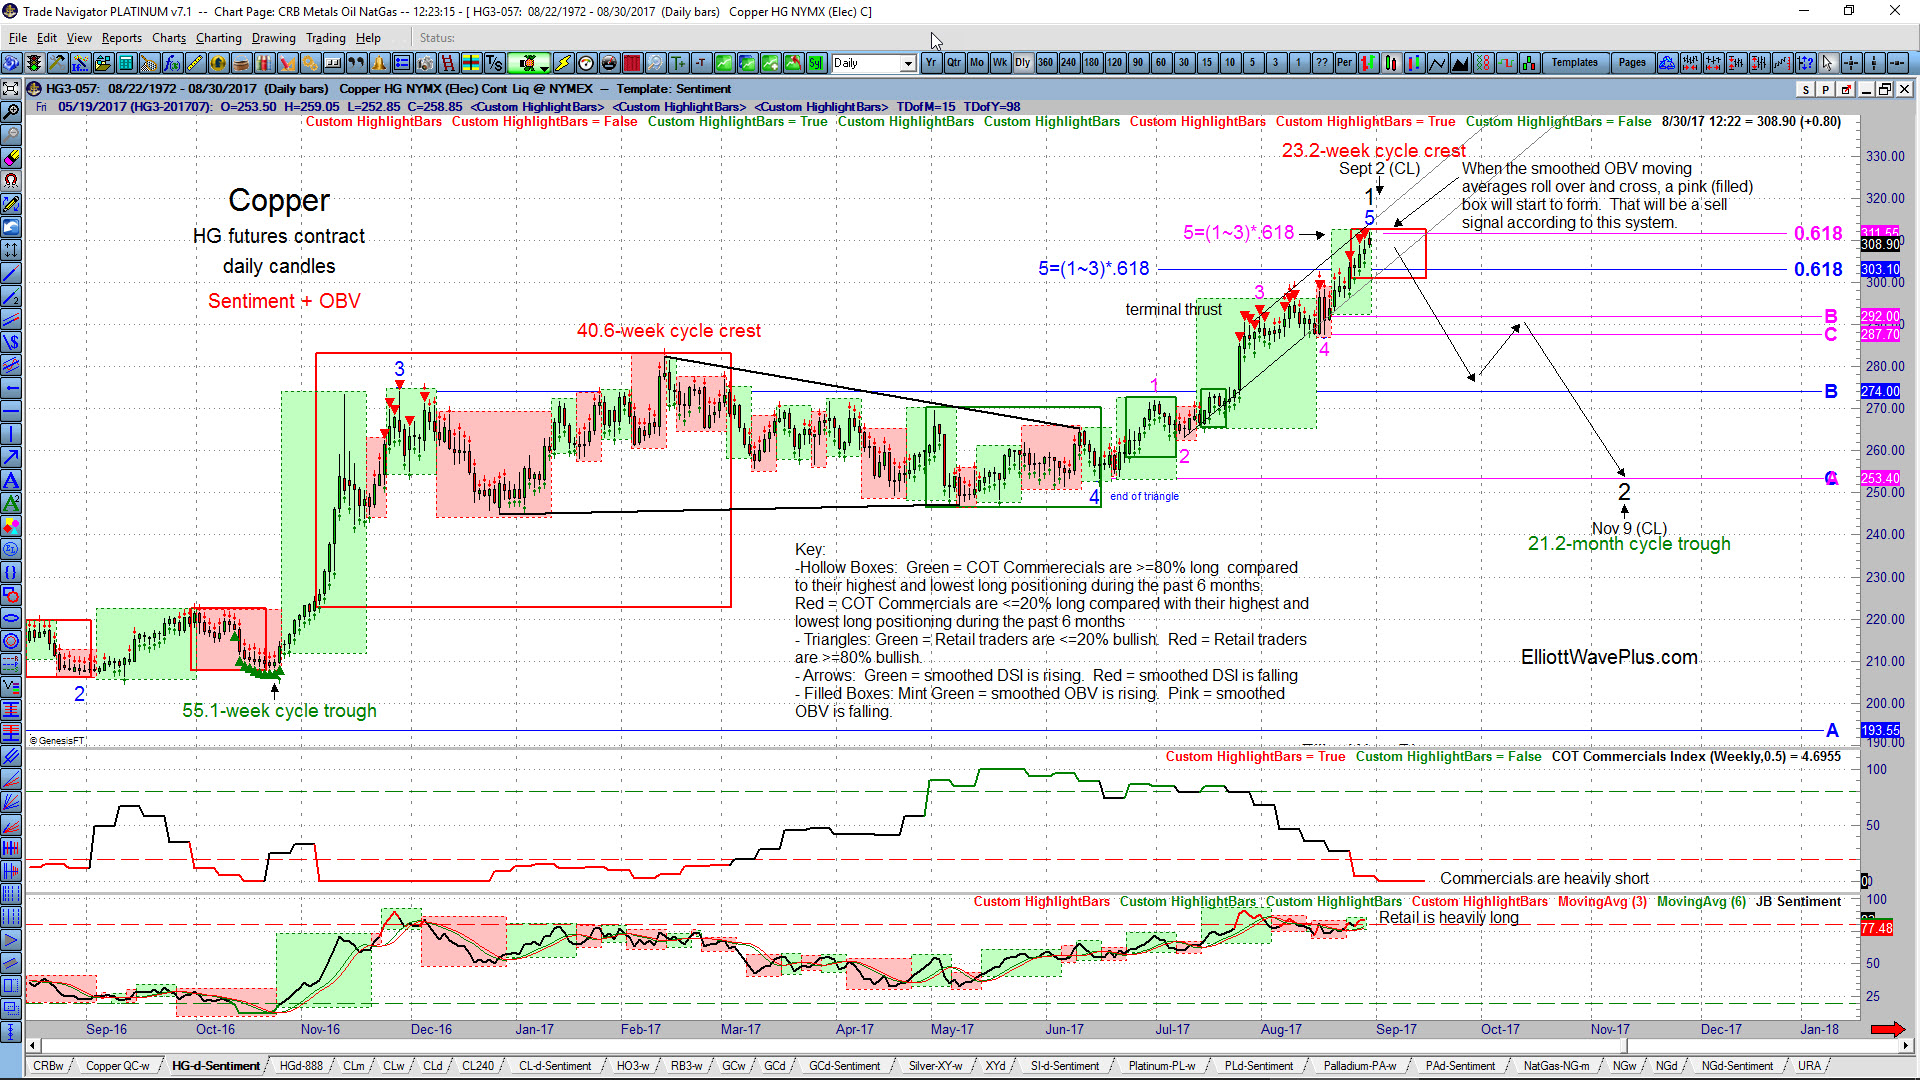
Notice on the chart that retail traders have been chasing copper “en masse” to the upside in recent weeks. This is shown by the red triangles above the price bars. Those red triangles only appear when retail traders (the DSI / JB Sentiment indicator) are at 80% bullishness or greater. Retail traders are chasers, so they generally do well in strong trending waves, until the trend is over this is, at which point they are reliably “all in” on the wrong side of the market. In essence, retail traders (and trend-following algos) herd to one side of the boat, causing it to capsize.
This is where we bring in COT Commercials positioning and the smoothed OBV (On-Balance Volume) indicator (among other things) to assist with timing. In the Copper chart above, if traders had recently attempted to use extreme bullish DSI (Retail) positioning to start shorting copper, they would have been way early, and probably stopped out multiple times. However if they had waited for Commercials to build their short positions enough to reach only 20% bullishness, compared with their range of bullishness over the last 6-months (shown by the hollow red box), they could then look for a short-term indication of a trend-change to the downside via our smoothed OBV (On-Balance Volume) indicator, shown on the chart by the pink (filled) boxes. Notice on the Copper chart that we don’t have the start of a new pink filled box yet, although it could appear any day. All other conditions for a short position have been met though: Commercials are less than 20% bullish, and Retail has very recently been 80% bullish or greater.
Here at ElliottWavePlus, we present Pro-Plan and Basic-Plan subscribers with the above chart template every weekend on each of the following futures contracts: S&P-500 (ES), German DAX (GX), 30-year Treasury Bonds (ZB), Copper (HG), Crude Oil (CL), Heating Oil (HL), RBOB Gasoline ( RB), Gold (GC), Silver (SI), Platinum (PL), Palladium (PA), Natural Gas (NG), Corn (ZC), Soybeans (ZS), Wheat (ZW), Oats (O), Cocoa (CC), Sugar (SB), Coffee (KC) Orange Juice (OJ), Cotton (CT), Lumber (LB), Live Cattle (LE) Lean Hogs (LE), US Dollar Index (DX), Japanese Yen (G6J), Canadian Dollar (G6C), Euro (G6E), British Pound (G6B), Australian Dollar (G6A), NewZealand Dollar (G6N) and Mexican Peso (G6M).
Conclusion: Traders really should be aware of the exact sentiment spread between Large Commercials (producers) and Retail Traders at all times when trading. And they need a way to time entries based on that information. Subscribers to paid services at Elliott Wave Plus are provided with that edge, and a lot more.
Sid Norris