[vc_row][vc_column][vc_column_text title=”What’s Up With Gold?”]Gold has certainly seen an interesting 2016! From December 3, 2015 to July 6, 2016 gold rallied 30% (from $1061.80 to $1388.50). Since that mid-year high, gold has fallen back to $1158.60 as of this morning, December 5, 2016, a drop of about 16%. Let’s take a look at the technical picture, Elliott Wave Plus style.
Below is my current weekly chart of the GC continuous futures contract:
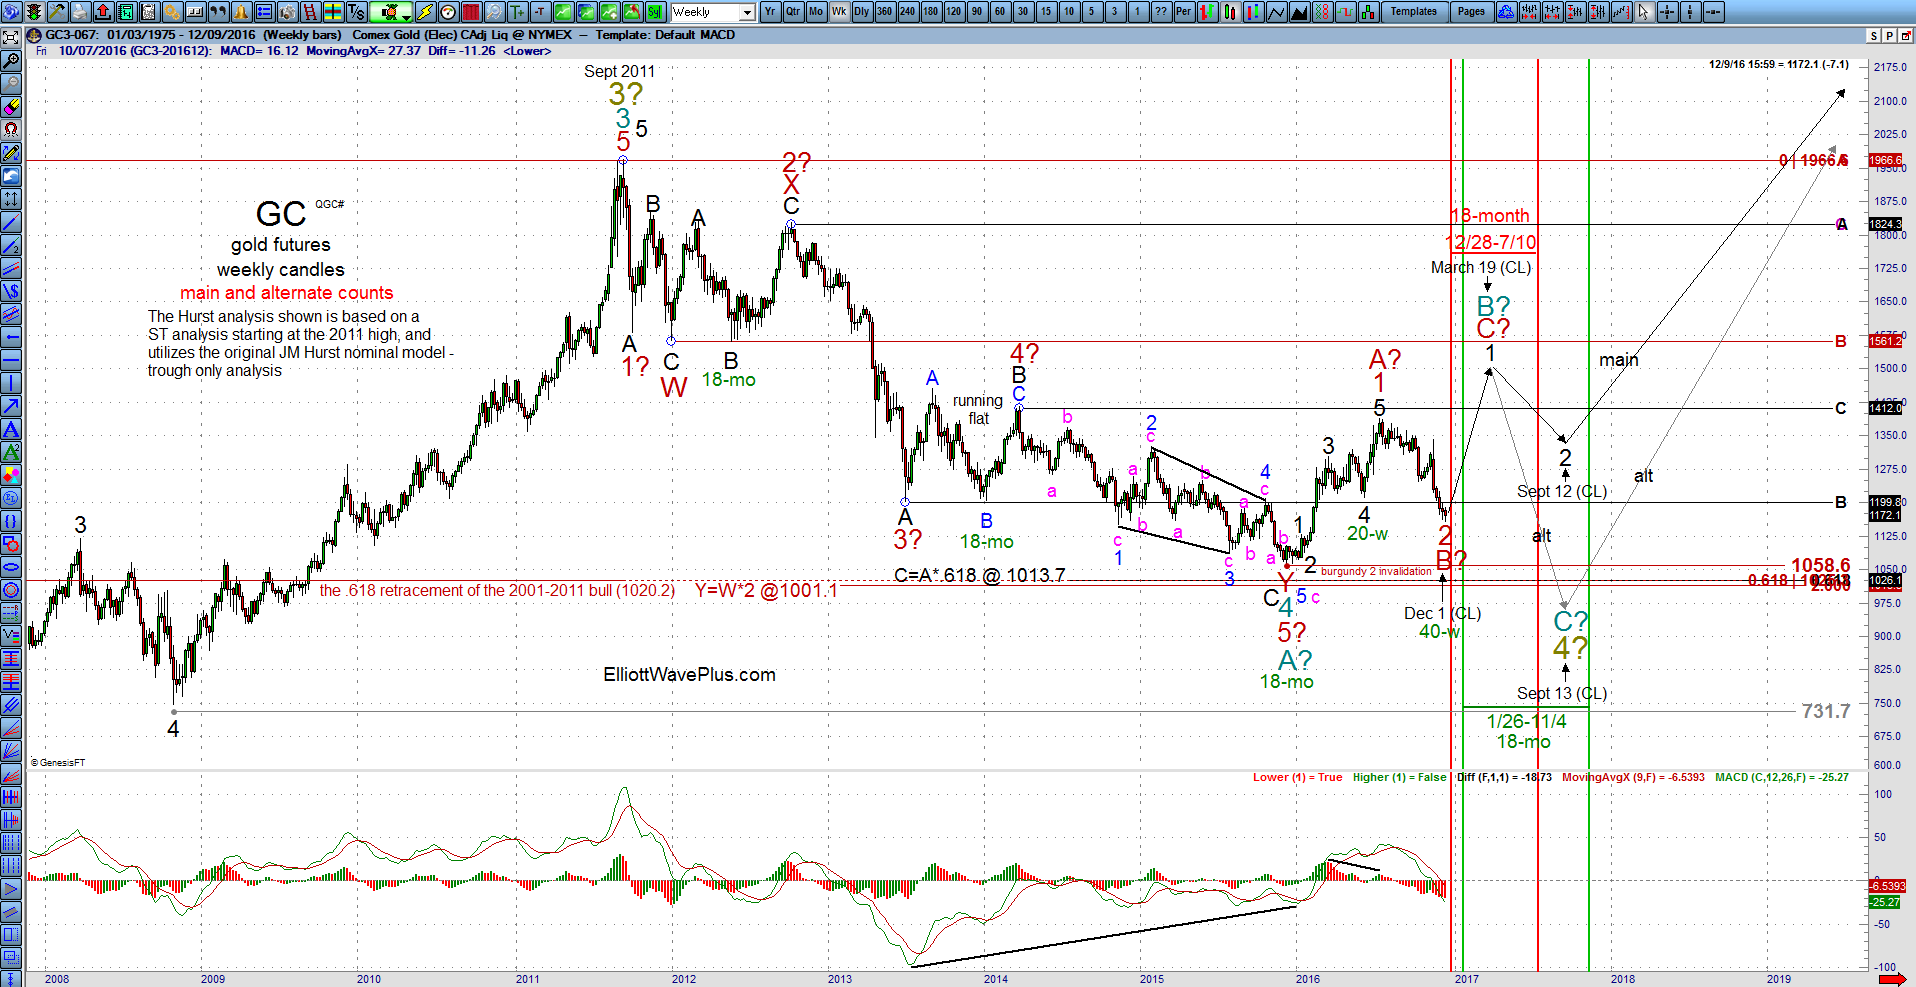 On this weekly chart, we can see that:
- My main Elliott wave count from the 2011 top to the 2015 low is corrective. This is important because it suggests that new all-time highs in gold are ahead of us.
- The upward movement from the December 2015 low to the July 2016 high counts best as a 5-wave impulse. This is also very important because is suggests that after over four years of bear market, gold’s 6-month long, five-wave rally is just the beginning of a larger bullish structure. In other words, there should be at least one more 5-wave leg to the upside before any new lows below the December 2015 low occur, no matter what the larger wave count is.
Now for the daily chart:
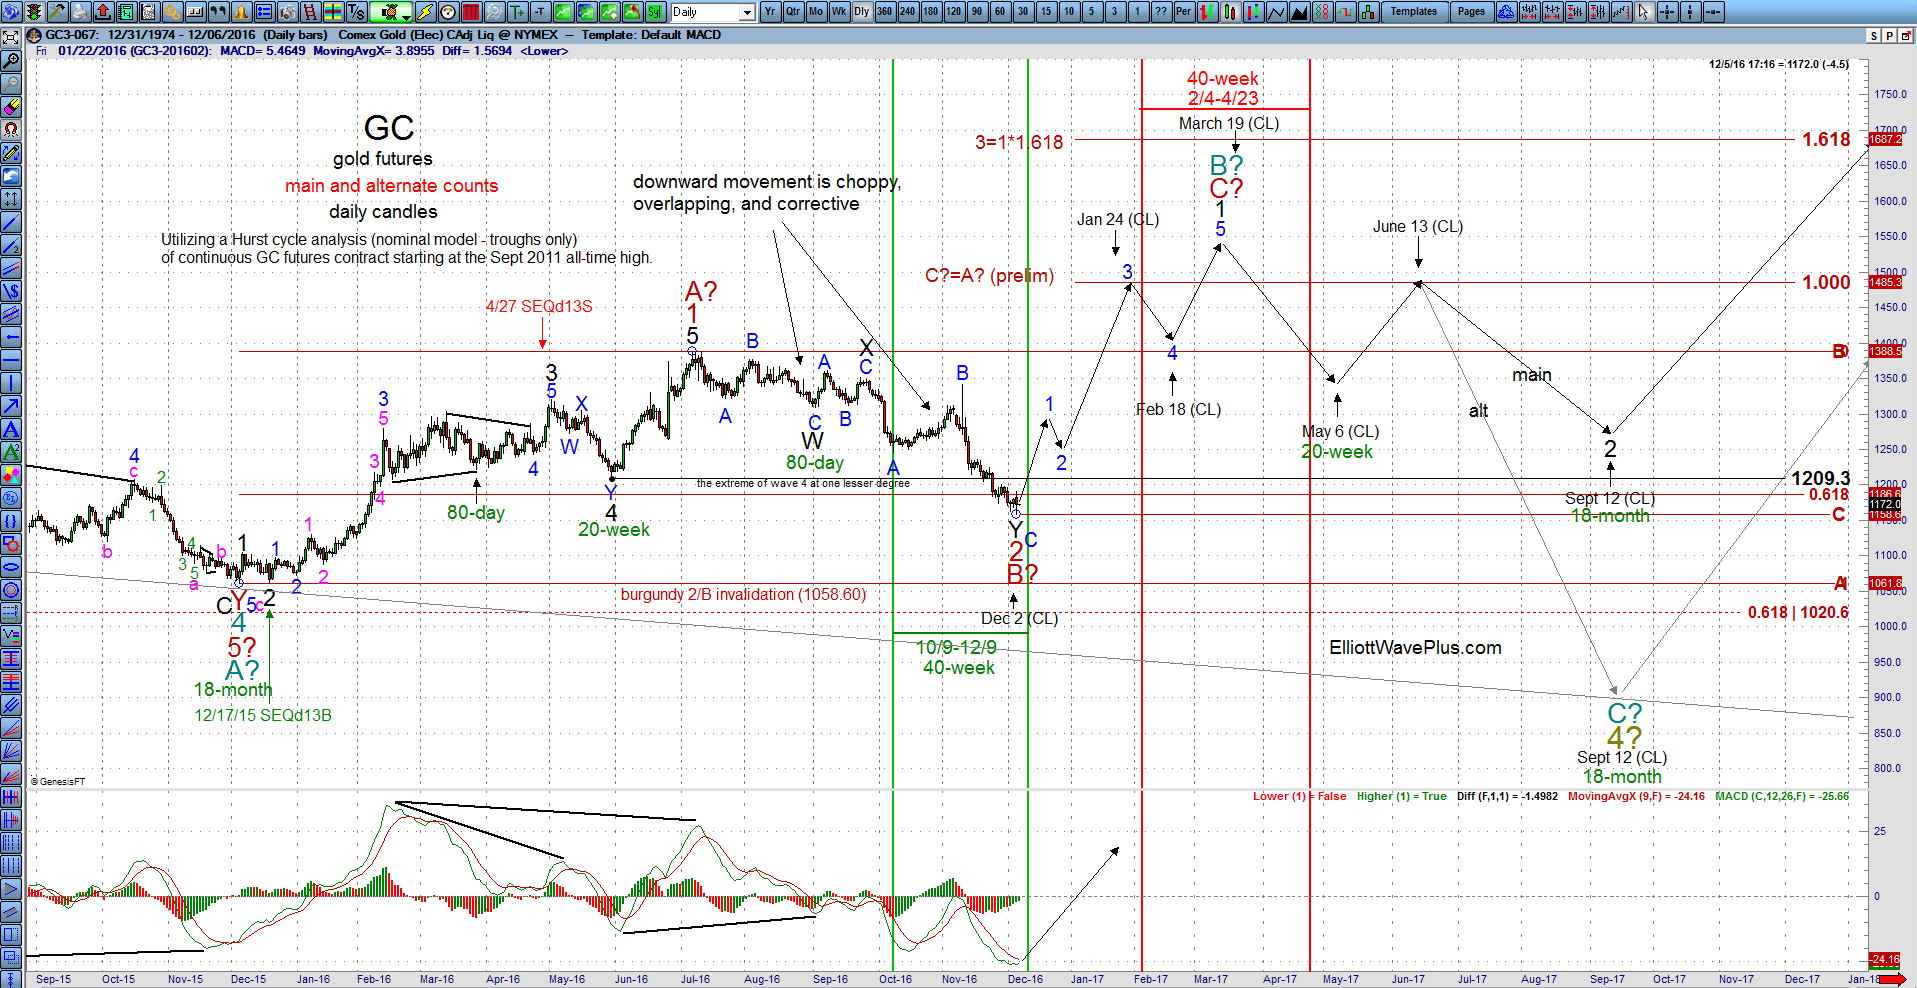
- From a Hurst cycle perspective, the December 2015 low was very likely an 18-month cycle trough or larger. Within each 18-month Hurst cycle, there are two 40-week cycles. The 40-week cycle trough in the middle of 18-month cycles is often referred to as the mid-cycle pause. Utilizing a Sentient Trader (nominal model – troughs only) analysis starting at the September 2011 high, a 40-week cycle trough is due between October 11 and December 9. We are getting late in that window, so a substantial bounce is a bit overdue.
- The downward movement in gold from the July high is clearly choppy, overlapping, and corrective. I believe it counts well as a complete, or very nearly complete double zigzag.
- If gold is putting in its 40-week cycle trough about now, the next 40-week cycle crest is due between February 4 and April 23 of next year. The Sentient Trader composite line, which considers the directional pressure of all simultaneously operating cycles within the Sentient Trader analysis suggests that gold’s 40-week cycle trough was due on about December 1, and the next 40-week cycle crest is due on or about March 19, 2017.
Here’s the 240-minute chart:
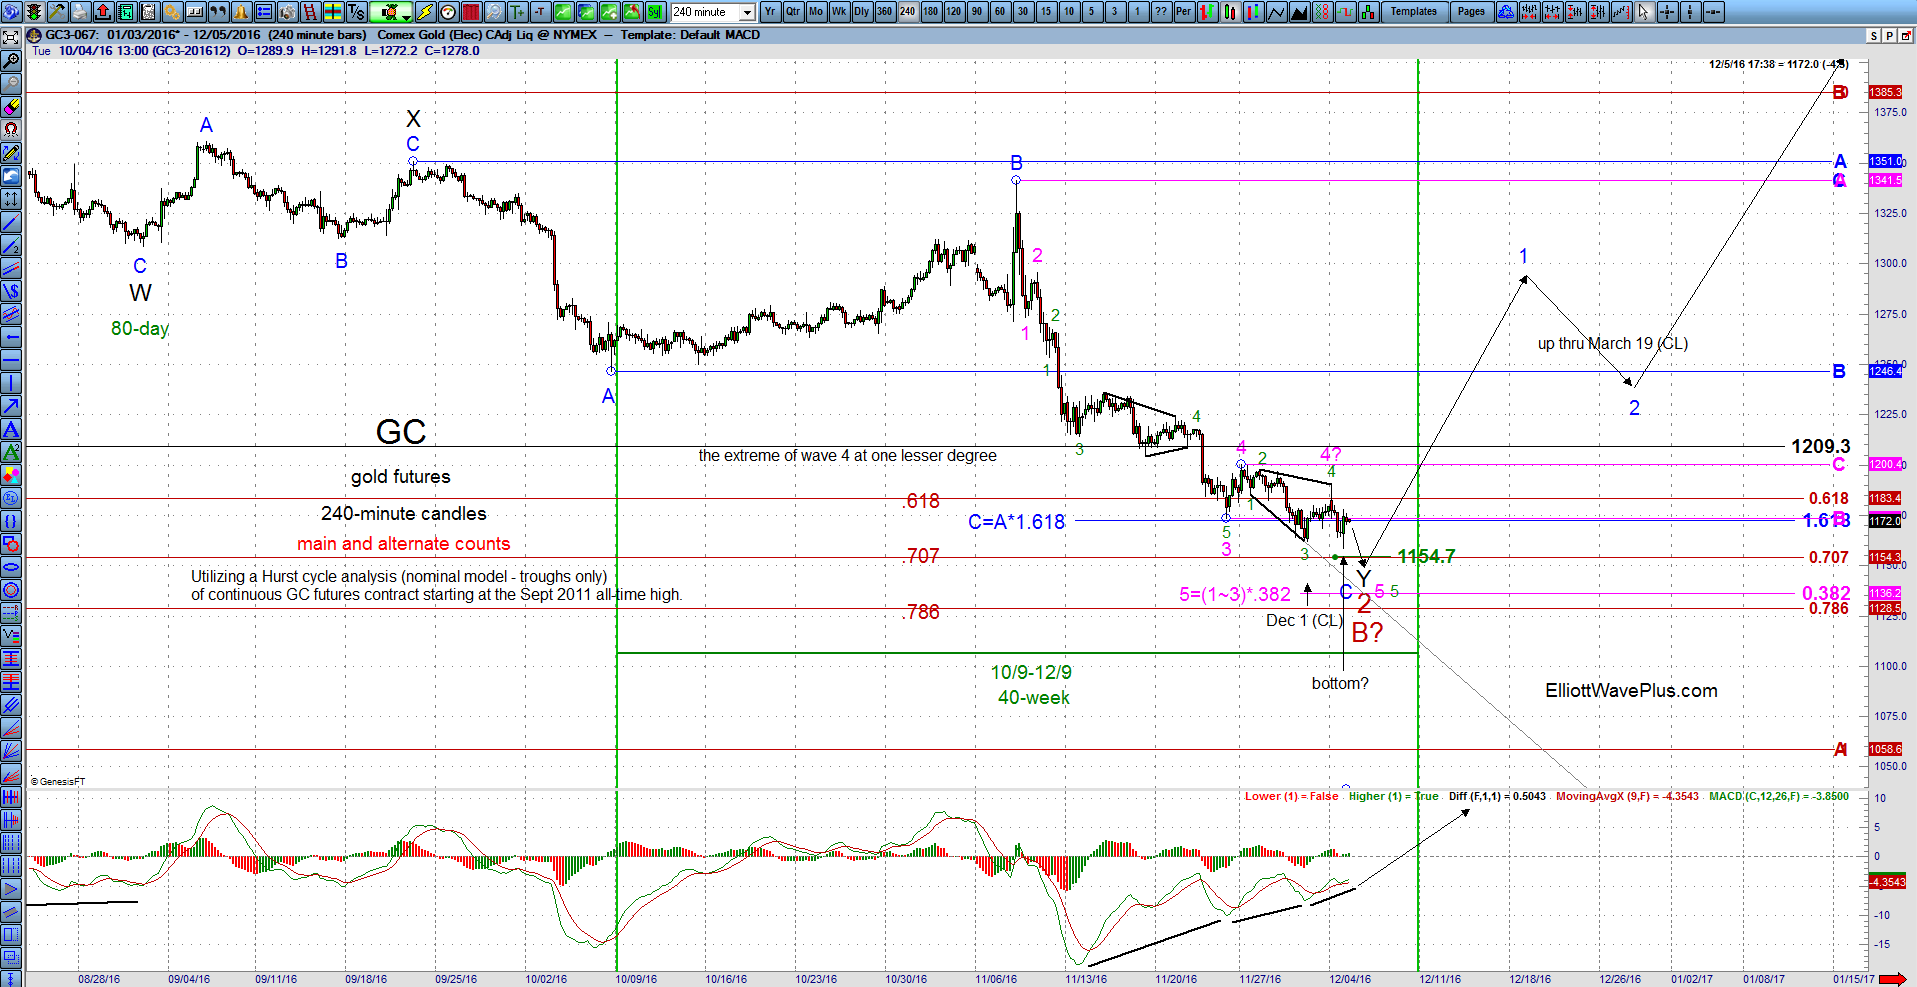
- Notice the series of Fibonacci price targets. Gold appears to be finding support where blue wave C equals blue wave A times 1.618, at 1172.30. Also nearby is the .618 retracement of the Dec 2015 through July 2016 bull, at 1183.40.
- There are other potential Fibonacci targets at slightly lower levels, but as soon as gold finishes 5-waves down from November 9 peak, I believe a rally from a 40-week cycle trough will be next.
- I can see the possibility of one last leg to the downside to just below 1154.7, but it is also possible that gold put in the 40-week cycle low today.
- We’ve already seen two 240-minute bullish MACD divergences. While three in a row is possible, triple 240-minute MACD divergences are fairly rare.
Finally, take a look at Trade Navigator’s sentiment indicator on a daily chart:
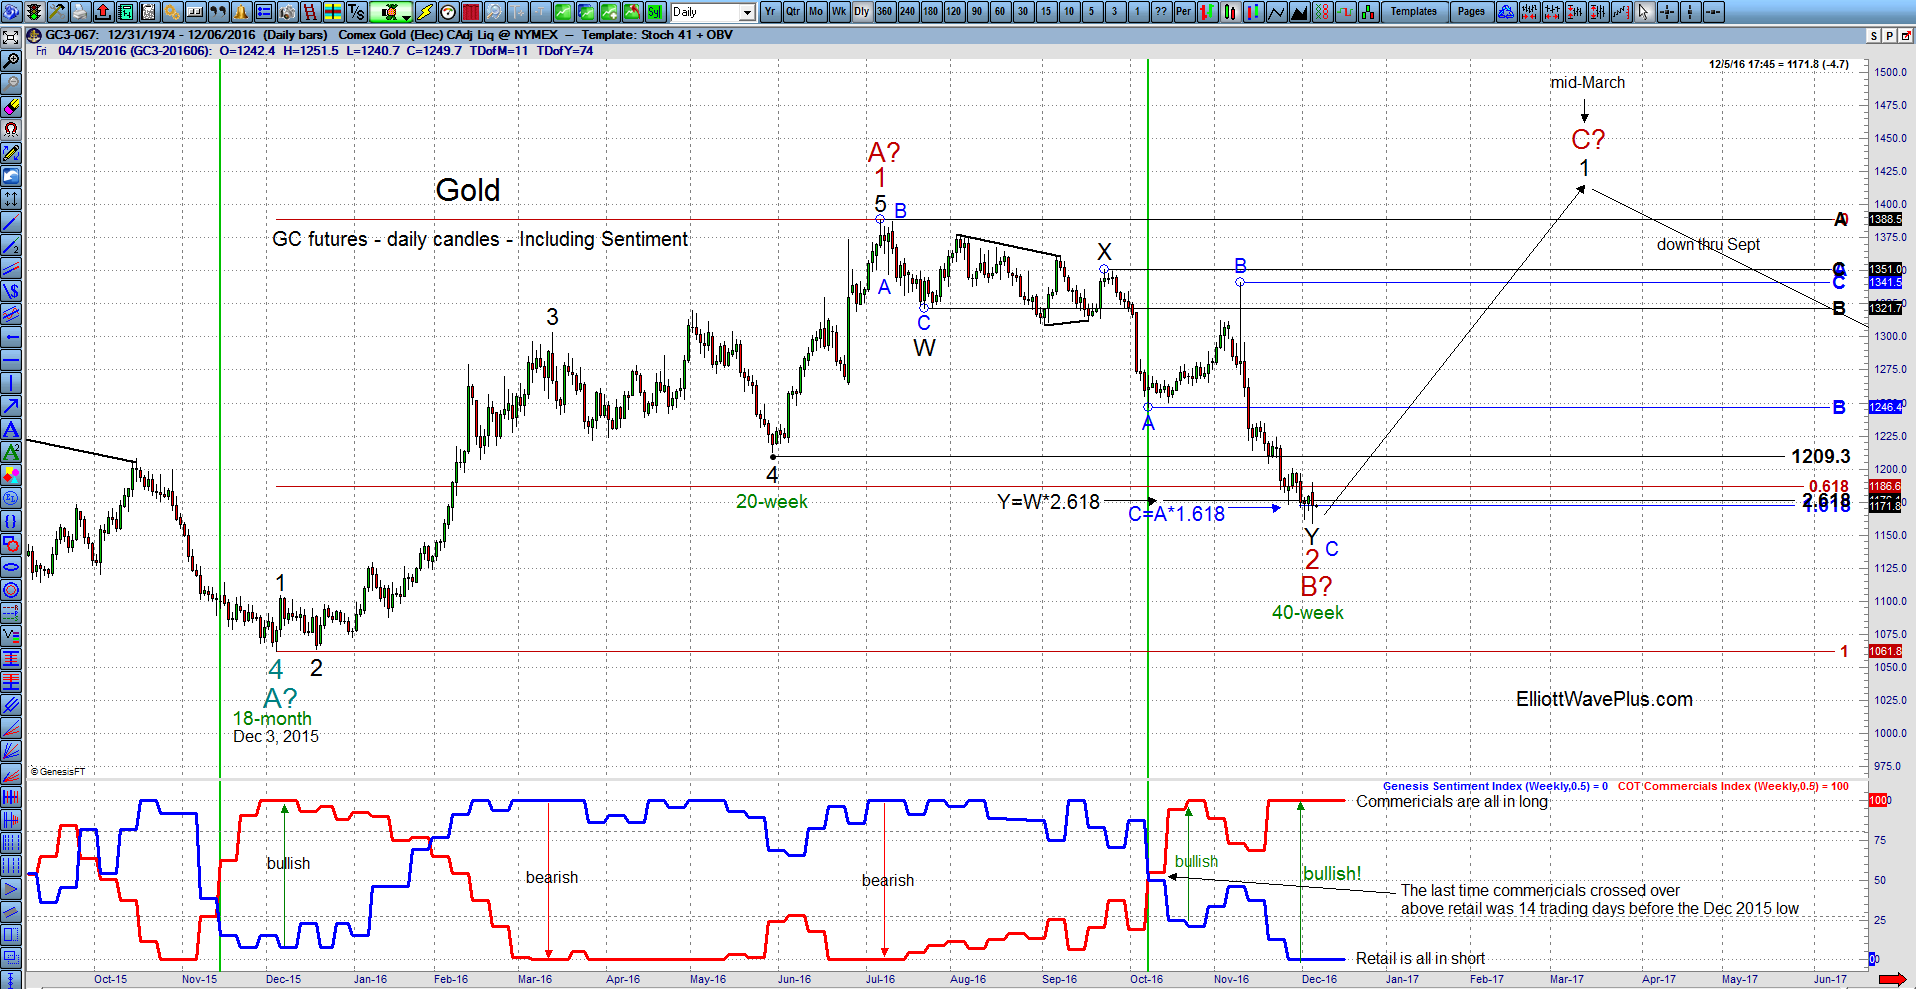
Once again, you don’t see this sentiment setup every day, week or month. The large commercial traders are “all in” long while retail traders are “all in” short. I’ll see this kind of spread from time to time on intraday charts, but not very often at all on a daily. This condition almost always leads to a significant trend change.
One last note: Another indicator I track is Tom Demark’s Sequential indicator, which fired a daily 13 exhaustion buy signal on GDX at the close on Thursday, December 1. These mechanically generated signals aren’t always trustworthy, but when they occur in conjunction with so many other important clues, the results are generally excellent.
Summary: Technical conditions are ripe for a sizable, multi-month bounce in Gold.
Sid Norris – ElliottWavePlus.com[/vc_column_text][/vc_column][/vc_row]