ELLIOTT WAVE PLUS
IT’S THE PLUS THAT MAKES THE DIFFERENCE!
Our system of carefully combining multiple methodologies of technical analysis creates higher confidence, less subjective market forecasts for traders.
WELCOME!
My name is Sid Norris and welcome to Elliott Wave Plus! I’ve been an active investor, trader, and student of the financial markets for over 30 years. From 2011 through 2016, I provided market forecasts for subscribers at ElliottWavePredictions.com.
During that five year period, I continually sought new ways to improve the accuracy and usefulness of the wave principle. In 2013, Hurst Cycle Analysis was added to the toolkit. Over the next three years, the ability to combine Hurst with Elliott evolved and improved. Additional methodologies were added, and the result is a unique system of technical analysis with built-in “checks and balances”.
Elliott Wave Plus is the culmination of everything I’ve learned about technical analysis, market forecasting, and Elliott Wave analysis. If you choose to subscribe, I hope our work is most beneficial to you!

OUR SYSTEM
Over the years, we’ve found several methods of technical analysis to be worthy of constant consideration when trading. This combination of robust forms of technical analysis creates a holistic approach to trading that is more powerful than Elliott Wave theory analysis alone.
Computer algorithmic trading has gained tremendously in popularity and utilization over the past few decades. Today, the great majority of trading volume comes from computer generated algo signals. Awareness of algo positioning in the markets has therefore become an important tool in our comprehensive approach to the analyzing and trading the markets. We scrutinize and combine daily trade signals from several carefully constructed algorithms based on sentiment, divergence, momentum, mean reversion, and trend-following. Timely awareness of current automated computer trading signals alongside our other systems and methods allows subscribers to quickly prioritize among current trading opportunities, and implement a suitable strategy.
Occasionally, market sentiment reaches meaningful extremes. For instance, at most major market tops, the great majority of retail traders are “all in” long, and the great majority of large commercial traders are heavily short. This is because retail traders are generally trend followers, and large commercial traders tend to “fade” mature trends. The opposite generally holds true at major market bottoms. Bear market crashes nearly always end with retail traders heavily short, and large commercial traders heavily long. The subsequent post-crash rally is then fueled by short covering, which is retail traders buying to exit short positions.
This extreme spread between the positioning of retail traders and large commericals is something we constantly look for, as it provides an optimum condition for trend change. Periods exhibiting extreme sentiment positioning can last for a weeks though, so trading solely on sentiment can be difficult from a timing perspective. However, it certainly is handy to be aware of extreme sentiment positioning when all of our other methodologies agree that a change of direction is imminent.
There are always correlations at work in the markets. Correlated items tend to move up and down together. While virtually all correlations come and go over time, it is well worth examining current market conditions to see if traditionally highly correlated items are moving together. For instance, if Gold is trending to the upside, the gold miners ETF (GDX) is also likely to rally. Another example, but this time of inverse correlation: if the US Dollar Index is weakening, commodities should generally rally, as they would be priced in weaker and weaker US dollars.
Sometimes, items that are normally correlated temporarily divorce themselves, only to hook back up later. In that case, the laggard is likely to “catch up” with the leader. Inter-market correlation conditions provide an important perspective on projected price direction.
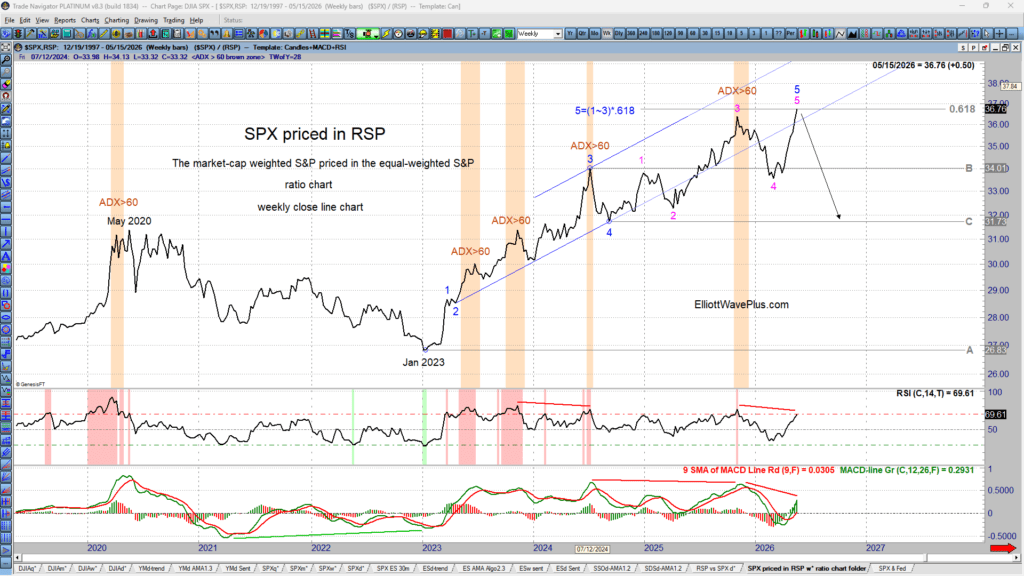
The MACD indicator is one of the most valuable standard indicators available on all trading platforms. “Divergence” is when price is making a new extreme, but a momentum indicator (like MACD) is not. Divergence between price and the indicator can indicate an imminent trend change. Also, the longer the timeframe of chart, the more powerful the potential trend change due to the divergence. For instance, you can wait a long time for MACD divergence to develop on a weekly or monthly chart, but the size of the coming trend charge (upon fully formed divergence) is likely to be substantial.
Careful monitoring of the MACD indicator on multiple chart timeframes can provide important clues as to future market direction because multiple divergences at smaller timeframes generally lead to a larger, more powerful divergence at larger timeframes. This is one of the reasons we use multiple timeframes, each showing the MACD indicator. For more details on how I utilize the MACD indicator, check out my video: “Early Detection of Trend Changes Using a Combination of MACD, and Japanese Candlesticks”.
JM Hurst was an American engineer who, in the 1960s and 70s, pioneered the use of the modern computer to analyze cyclical price movements within the financial markets.
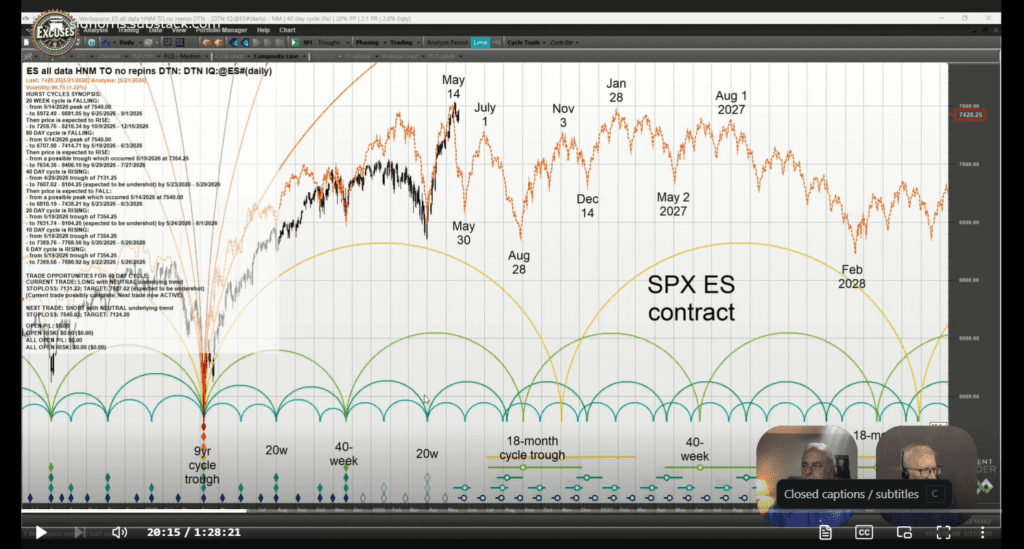
Hurst’s work suggested that there are multiple cycles acting on all financial markets at all times.Based on historical movement in the US stock market, he developed a “nominal model”, which identifies 18-year, 9-year, 4.5-year, 18-month, 40-week, 20-week, 80-day, 40-day, 20-day, 10-day, and 5-day cycles.These cycles overlap and combine to influence price movement. Each cycle can and will, in reality, vary a bit from the average historical length of that cycle, but as a general rule, if there are more cycles currently pushing to the upside than the downside, price tends to go up, and vice versa.
Hurst’s model explains why the markets occasionally trend very strongly. When most cycles align in their directional pressure, a fast, one-directional market results. He also observed that if price is strongly trending to the downside, a synchronized trough of numerous cycles is likely. Synchronized troughs create wonderful buying opportunities.
Fortunately, there is software available today to perform Hurst cycle analysis on any chartable item very quickly. That software is called “Sentient Trader”. I use Sentient Trader / Hurst analysis extensively, as it provides an ideal “check and balance” when used in combination with the potentially subjective Elliott Wave theory. For more information about Hurst cycle analysis and Sentient Trader software, check out SetntientTrader.com. Additionally, see my educational video: “Introduction to How I Combine Elliott Wave and Hurst Cycle Analysis”
Ralph Nelson Elliott (1871-1948) discovered the Wave Principle back in the 1930’s. He, had lost a lot of money as a result of the 90% stock market crash from 1929-1932, and wanted to find out in retrospect if there could have been a way to predict the crash ahead of time.He plotted historical price movements of the Dow Jones Industrial Average going back several decades by hand on graph paper, and upon close examination, found the existence of repetitive forms, or waves. He also found that price trends (wave lengths) were often related to prior wave lengths, and that those relationships were rooted in the Fibonacci sequence, and more specifically, the golden ratio (.618 & its inverse, 1.618).
OUR SUBSCRIPTION SERVICES
Elliott Wave Plus subscription choices include weekly webinars, nightly or twice-per-week screenshots, automated trade signals, and sentiment conditions updates
Daily Trend Reports Plus Cryptos
Trend Plan subscribers will receive daily (M-F) Trend Charts featuring easy-to-read buy and sell “zones”. Click below to find out which items are covered. Daily momentum-algo trade signals as well as our weekly and daily Elliott wave counts on Bitcoin and Ethereum are also included in the nightly trend reports.
EWP ScreenShots
The Basic Plan features consists of EWP ScreenShots published every Sunday and Wednesday. Included are multiple timeframe Elliott wave charts of the most popular tradeable items. Fibonacci price targets and Hurst cycle analysis is integrated into virtually all wave counts.
Sid's Weekly "Counts" Webinars
The Pro Plan features Sid’s weekly Elliott Wave “Counts” webinars, which feature extensive technical analysis of the world’s major stock markets, commodities, currencies, and bonds. Access to recordings of every Sunday session are included.
Nightly Algo Reports + Sentiment Conditions ScreenShots
Premium Plan subscribers now receive access to a nightly executive report (M-F). Each report covers 24 of the most popular tradeable instruments. Updated nightly, the report includes a general description of the current Elliott wave count and Hurst cycle analysis on all covered items, as well as the latest date and directional signal from our proprietary momentum algos. Our proprietary Sentiment Conditions screenshots are also included.
Recent News from Elliott Wave Plus

Momentum Algos and Automated Trading Webinar