Combining Elliott Wave, Fibonacci and Hurst Cycle Analysis to Predict the Future Direction of the Dow Jones Industrial Average
The following charts include my main and alternate wave counts and associated Fibonacci price targets for the Dow Jones Industrial Average, starting with the quarterly, then monthly, weekly and daily charts. Hurst cycle analysis is also utilized at all time frames.
—
Elliott Wave
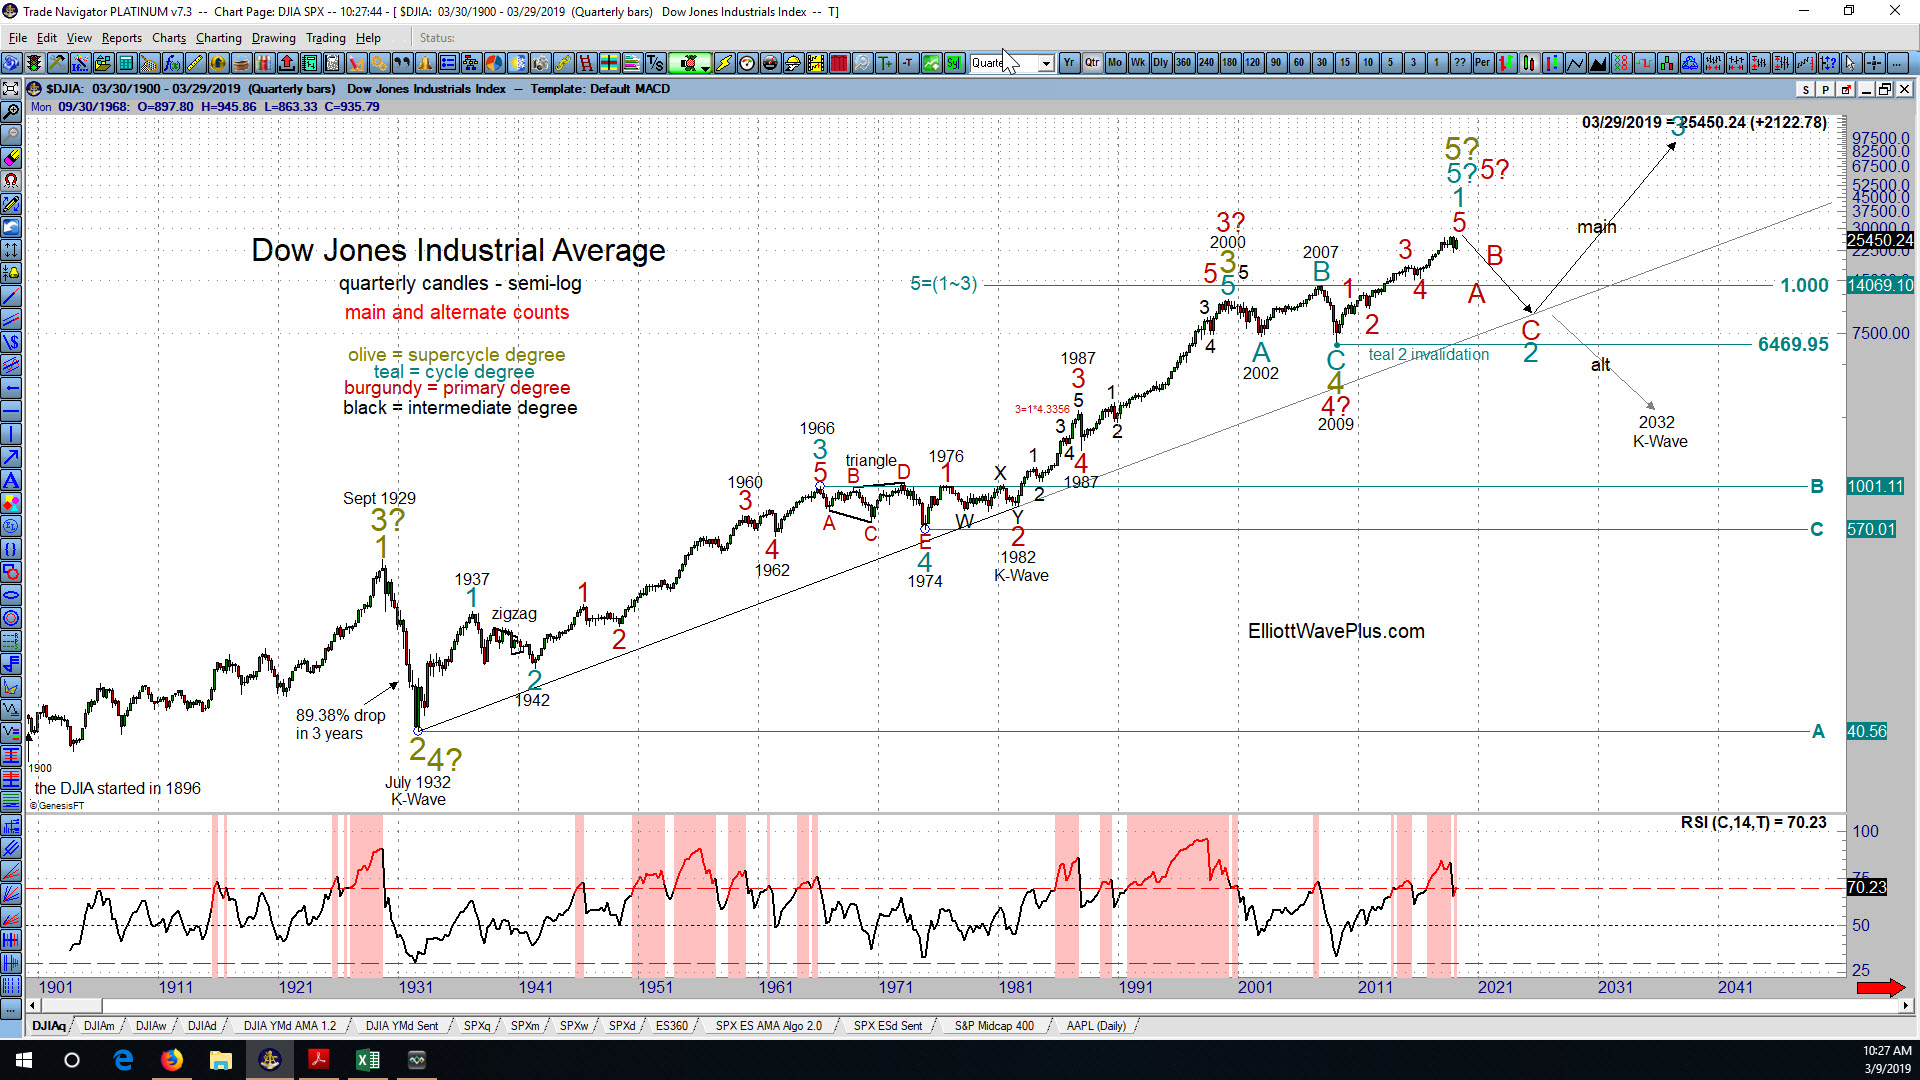
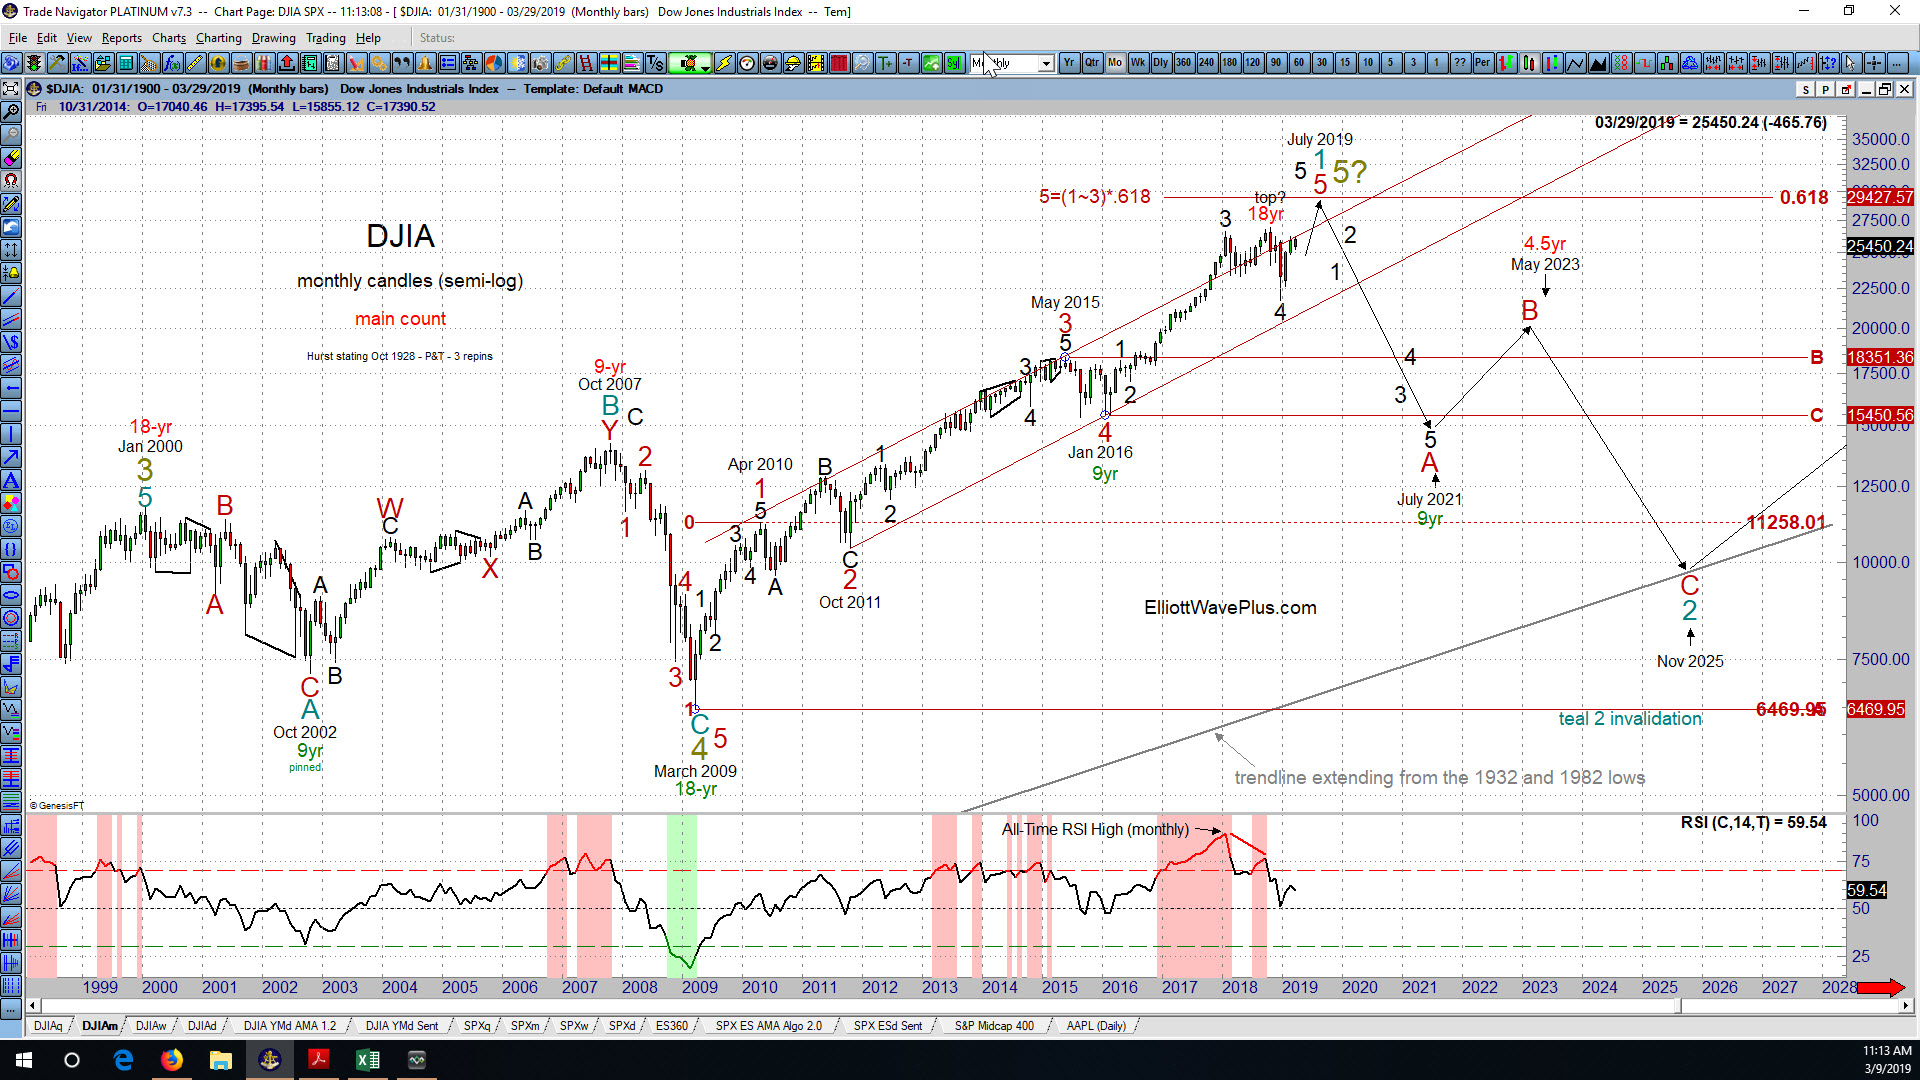
As you can see, my main count is that 5-waves up from the March 2009 low remain incomplete. On the monthly chart, I’ve labeled the March 2009 low as supercycle (olive) wave 4. Up from that low, both the main and alternate counts expect 5 waves up at either cycle (teal) or primary (burgundy) degree. I am labeling waves 1, 2, 3, and 4 are complete at the February 2016 trough. So 5-waves up from that low are all that is required to produce a very large cycle top, which I will label as either cycle (teal) wave 1, or supercycle (olive) wave 5.
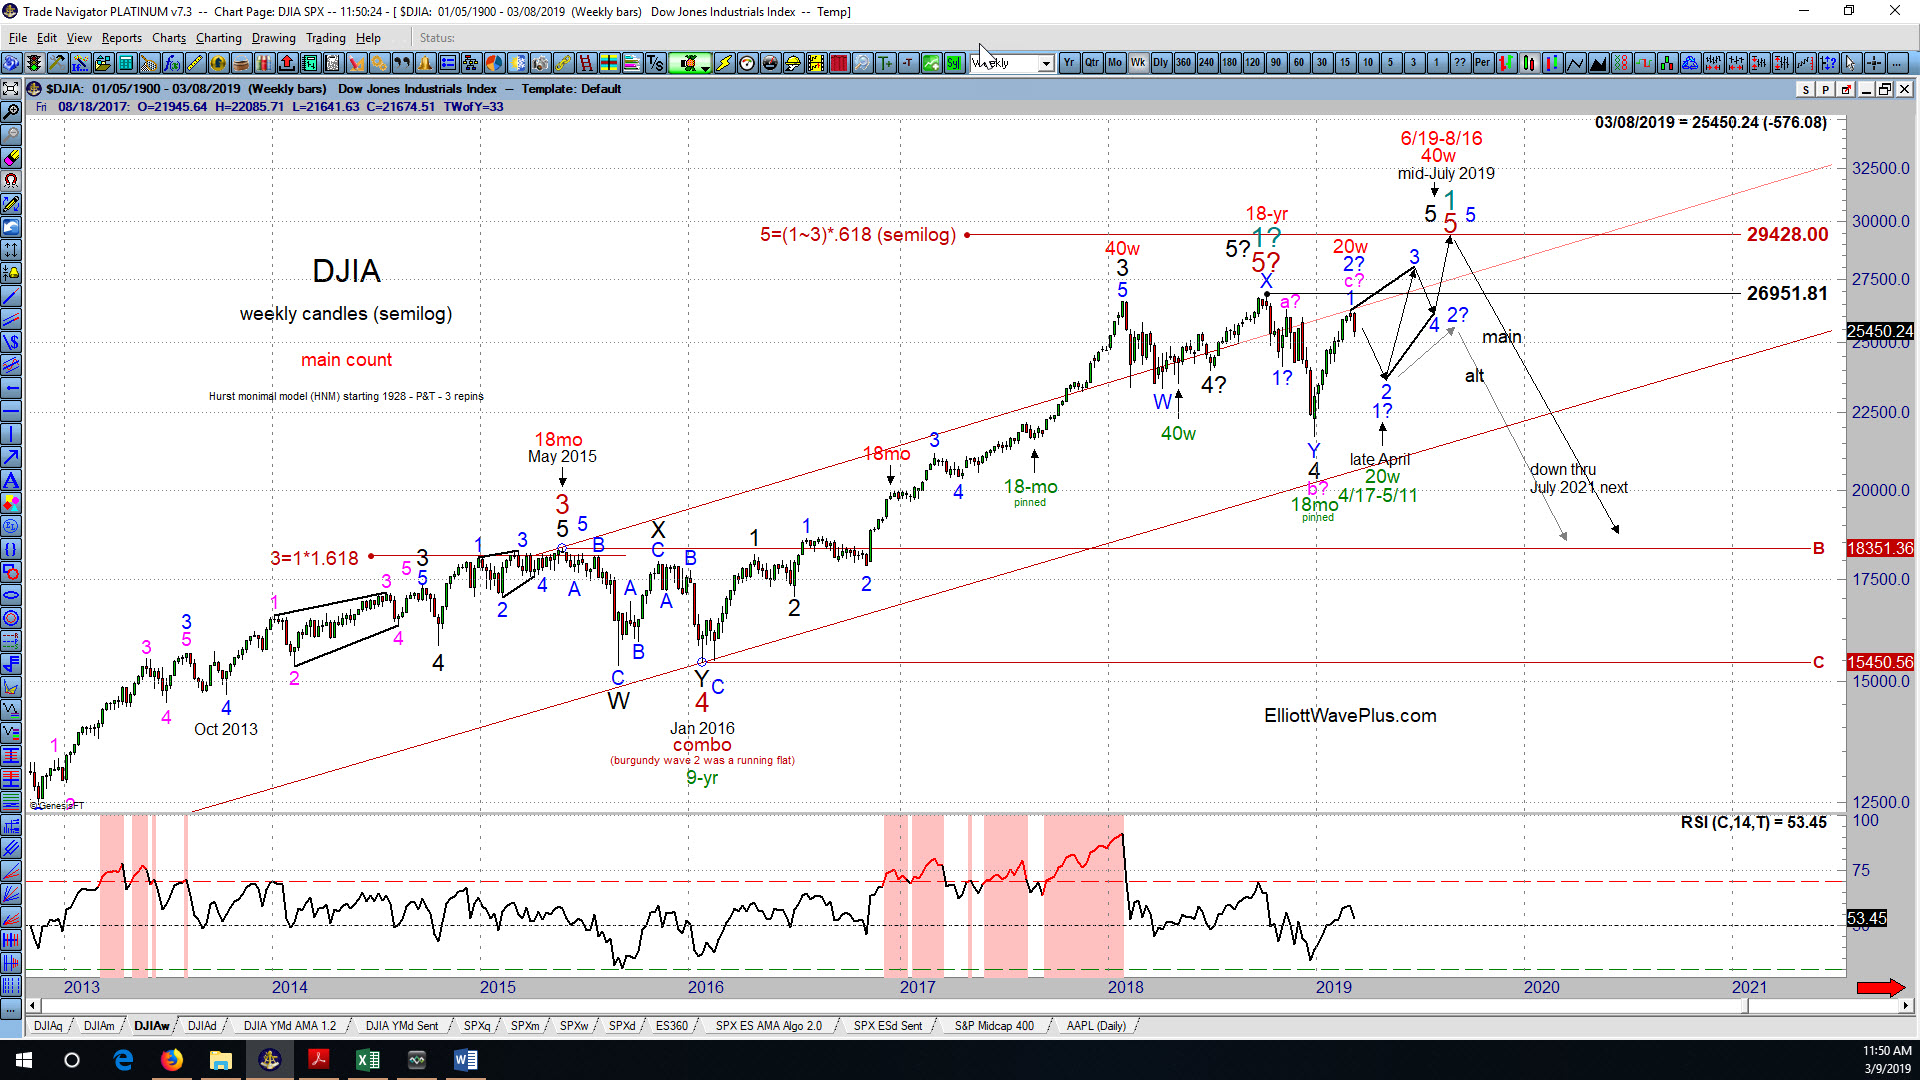
So up from the February 2016 low, on the weekly chart, we need 5-black waves up to complete the structure. I am labeling black waves 1, 2, 3 and 4 complete at of December 24, 2018 low. so now we need 5 minor (blue) waves up from that low to complete the large-degree structure. At this juncture, I am labeling the move up from Dec 24 thru Feb 25 as blue wave 1, with blue wave 2 to the downside now underway.
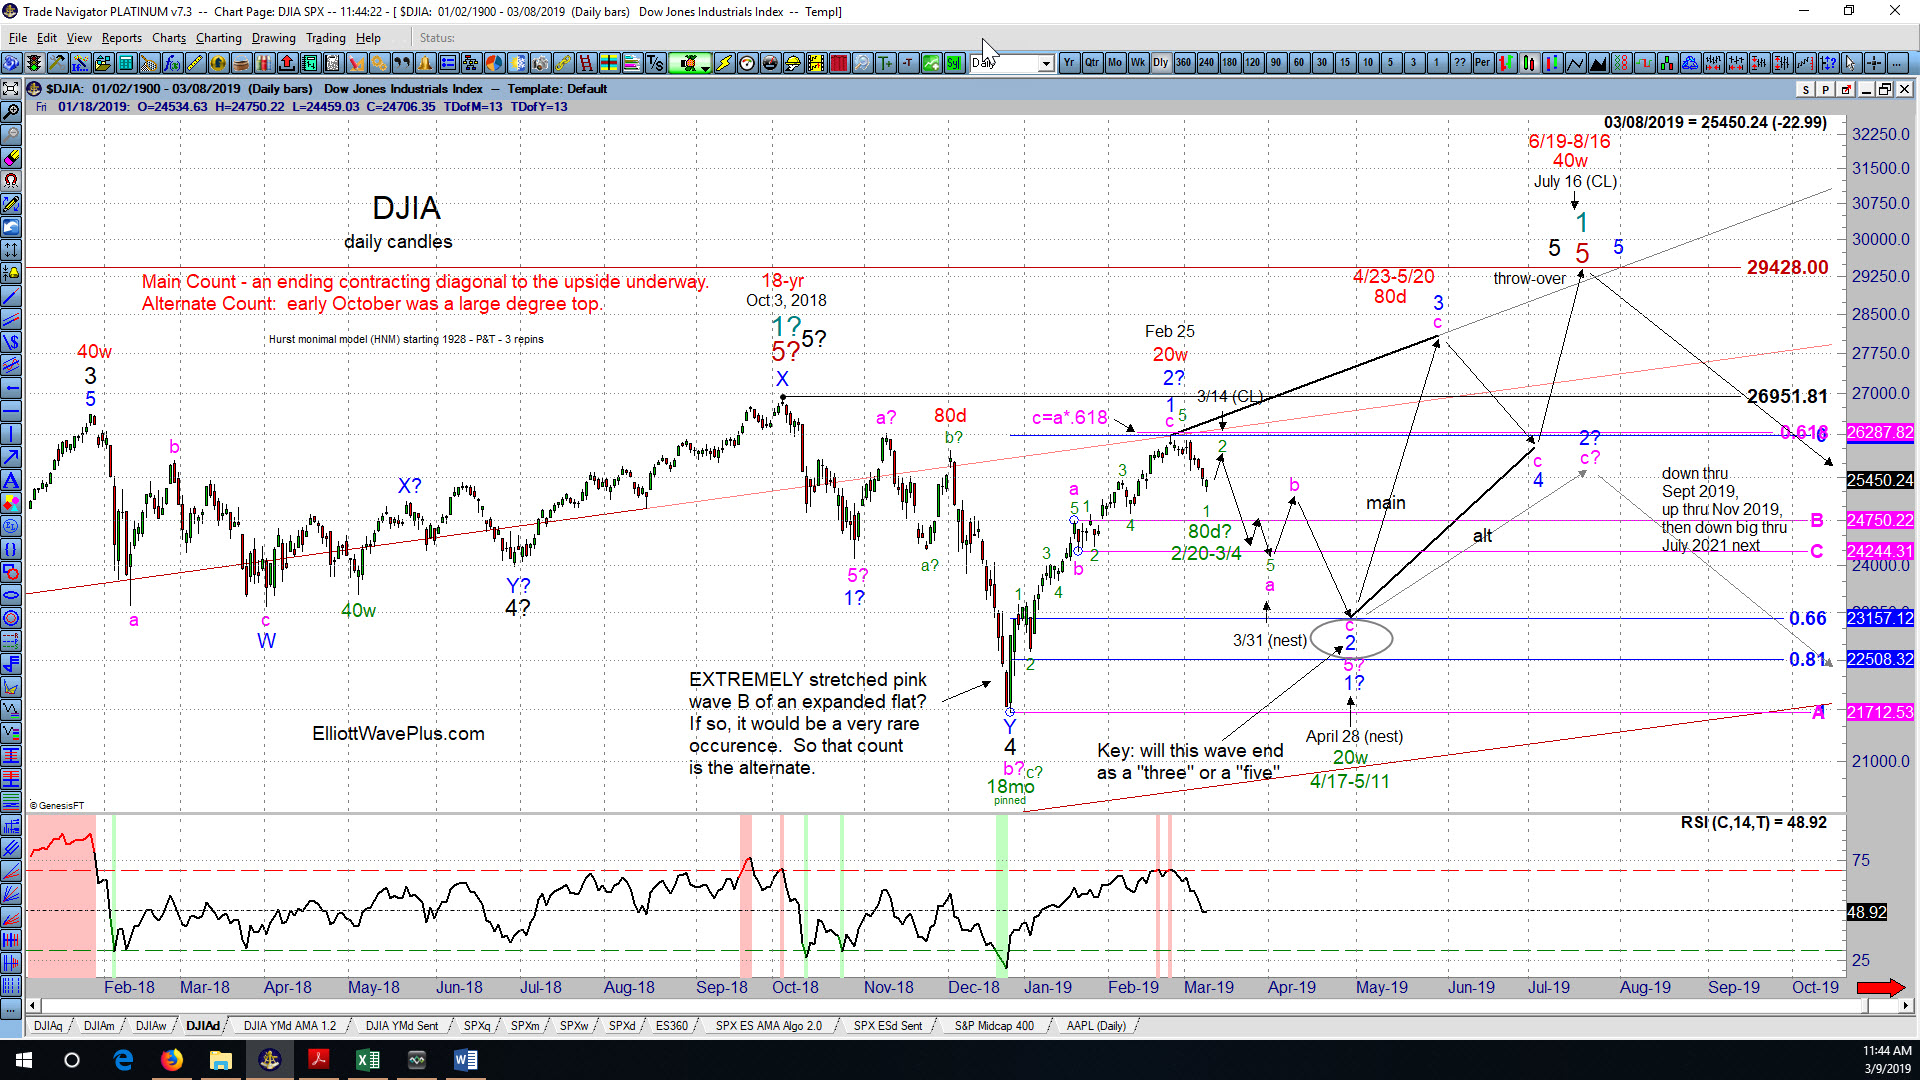
Notice that I am predicting that wave 5 black will be an ending contracting diagonal. The reasons why are twofold: 1) Primary (burgundy) wave 5 will reach a very normal .618 times the net traveled of burgundy waves 1 through 3 (semilog) at 29,428. After the strong 20%+ rebound starting Christmas Eve 2018, the DJIA is close enough to that important price target now that a standard 5-wave non-overlapping impulse would substantially overshoot it. 2) The move up starting Dec 24, as aggressive as it was, still counts nicely as an ABC zigzag. Each leg of diagonal is typically a zigzag.
Within ending diagonals, waves 2 and 4 typically retrace between 66 and 81 percent of the prior wave. So the target zone for the end of blue wave 2 is 22,508 ~ 23,157. How long will it take the DJIA to reach those targets? I use Hurst cycle analysis to assist in that regard.
Hurst Cycle Analysis
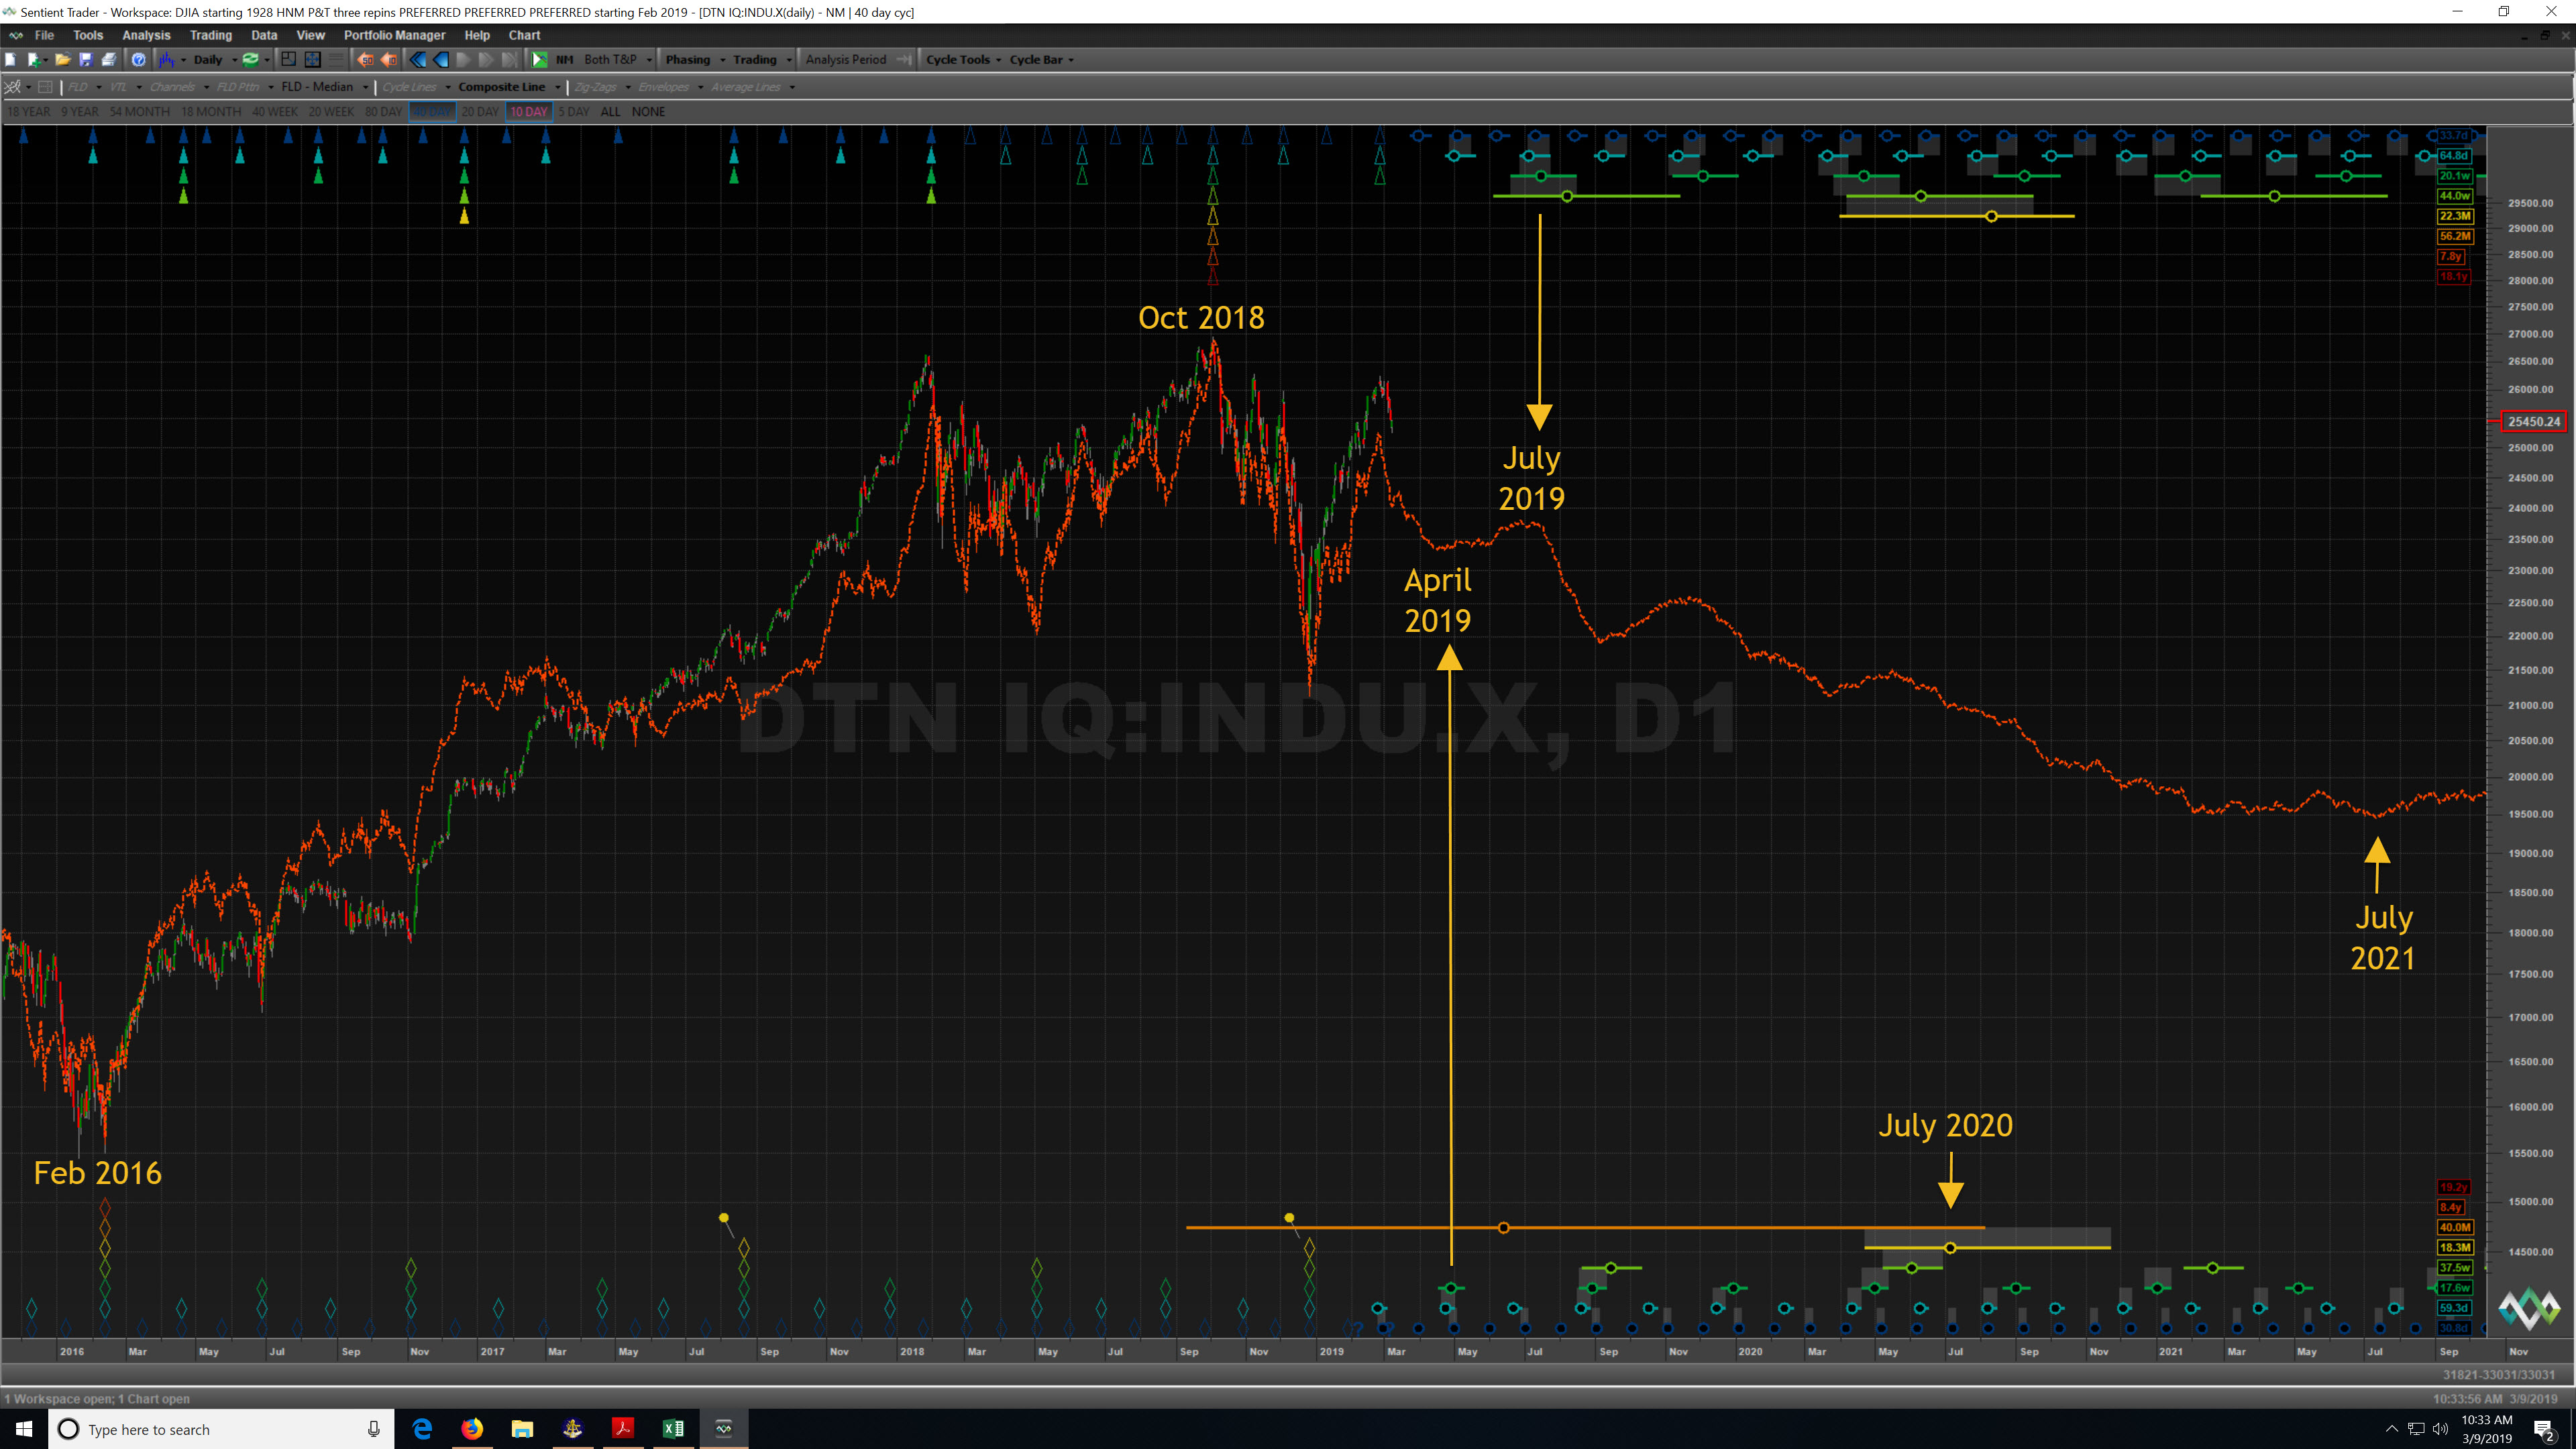
A Hurst cycle analysis of the DJIA starting in the year 1928, as derived by Sentient Trader software is projecting the Oct 2018 peak to be an 18-year cycle peak! This is why my alternate count is projecting that the Oct 2018 high may have been the end of 5-waves up from the March 2009 low. That same analysis is labeling the Dec 24 2018 low an 18-month cycle trough. This may explain the strength of the move up since Xmas eve.
That same analysis is now labeling the Feb 25 2019 high as a 20-week cycle peak. The next 20-week cycle trough is due in late-April 2019, so Hurst is expecting that the downward movement so far since Feb 25 is just the start of a larger move that will last several more weeks.
For reference, the screenshots below are my current Hurst cycle analysis of the DJIA. The composite line of the first screenshot includes the phantom “Sigma L” cycle. The second one excludes the Sigma L cycle from consideration. Please note that in my experience, Hurst cycle analysis is best used to suggest smaller cycle swings, like the 20-day cycle, the 40-day, 80-day, 20-week and 40-week. That is why I show the projected date ranges of those smaller cycles manually on my daily Elliott wave analysis charts. Those smaller cycles are generally considered the real-world trading cycles, which was J.M. Hurst’s original goal with his system. Please do not read too much into the range of the composite line (CL) over the long term. It is the date zones of the future “nests” of peaks and troughs that are much more important that the orange composite line. Additionally, please note that the orange composite line only projects direction, not price targets.

What’s Next?
The internal subdivisions of the projected move down from late-Feb thru late-April will provide a major clue as to likelihood of the main or alternate count. If it subdivides into 3 waves, the main count will continue as the preferential count. However, a move down in 5-waves will strongly suggest the alternate.
Thanks for reading, and please consider a subscription! If you have questions regarding subscription, please email me at [email protected].
Sid Norris – https://elliottwaveplus.com/