Is The Stock Market Losing Upward Momentum?
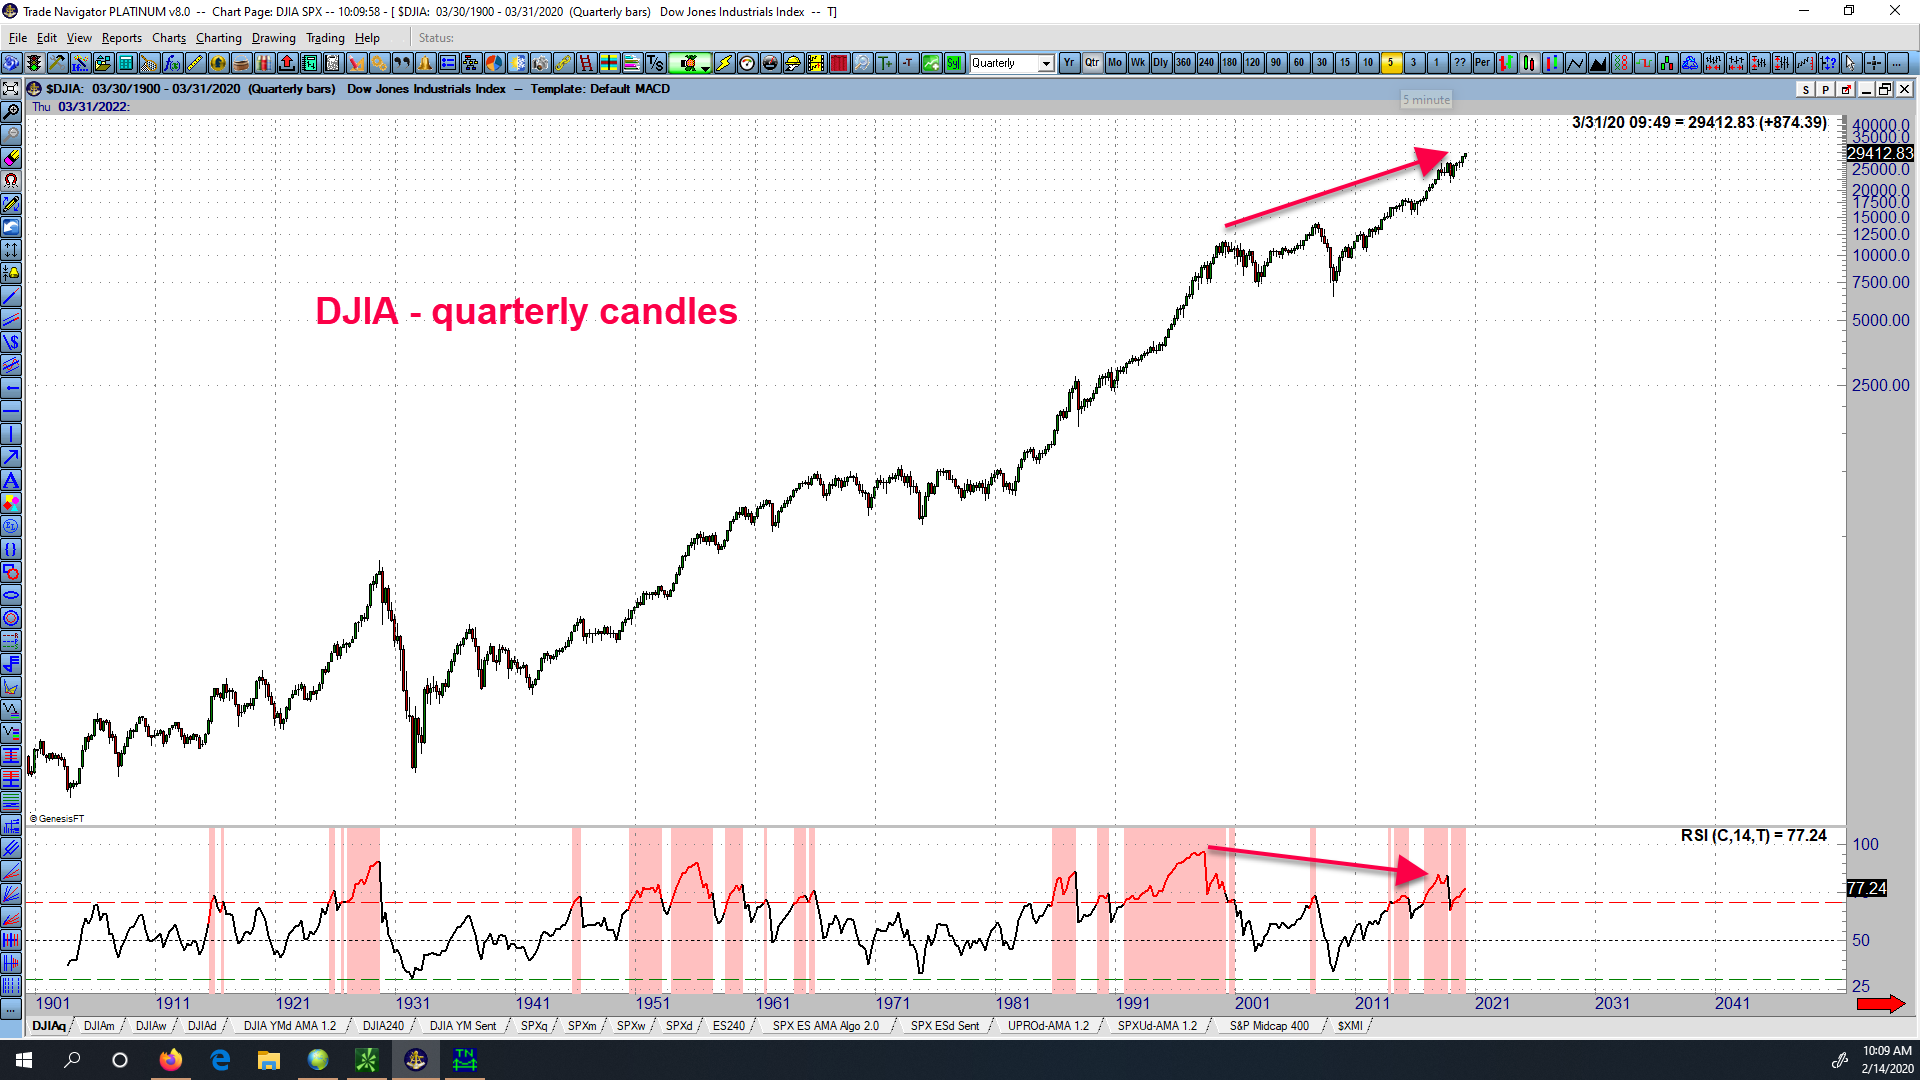
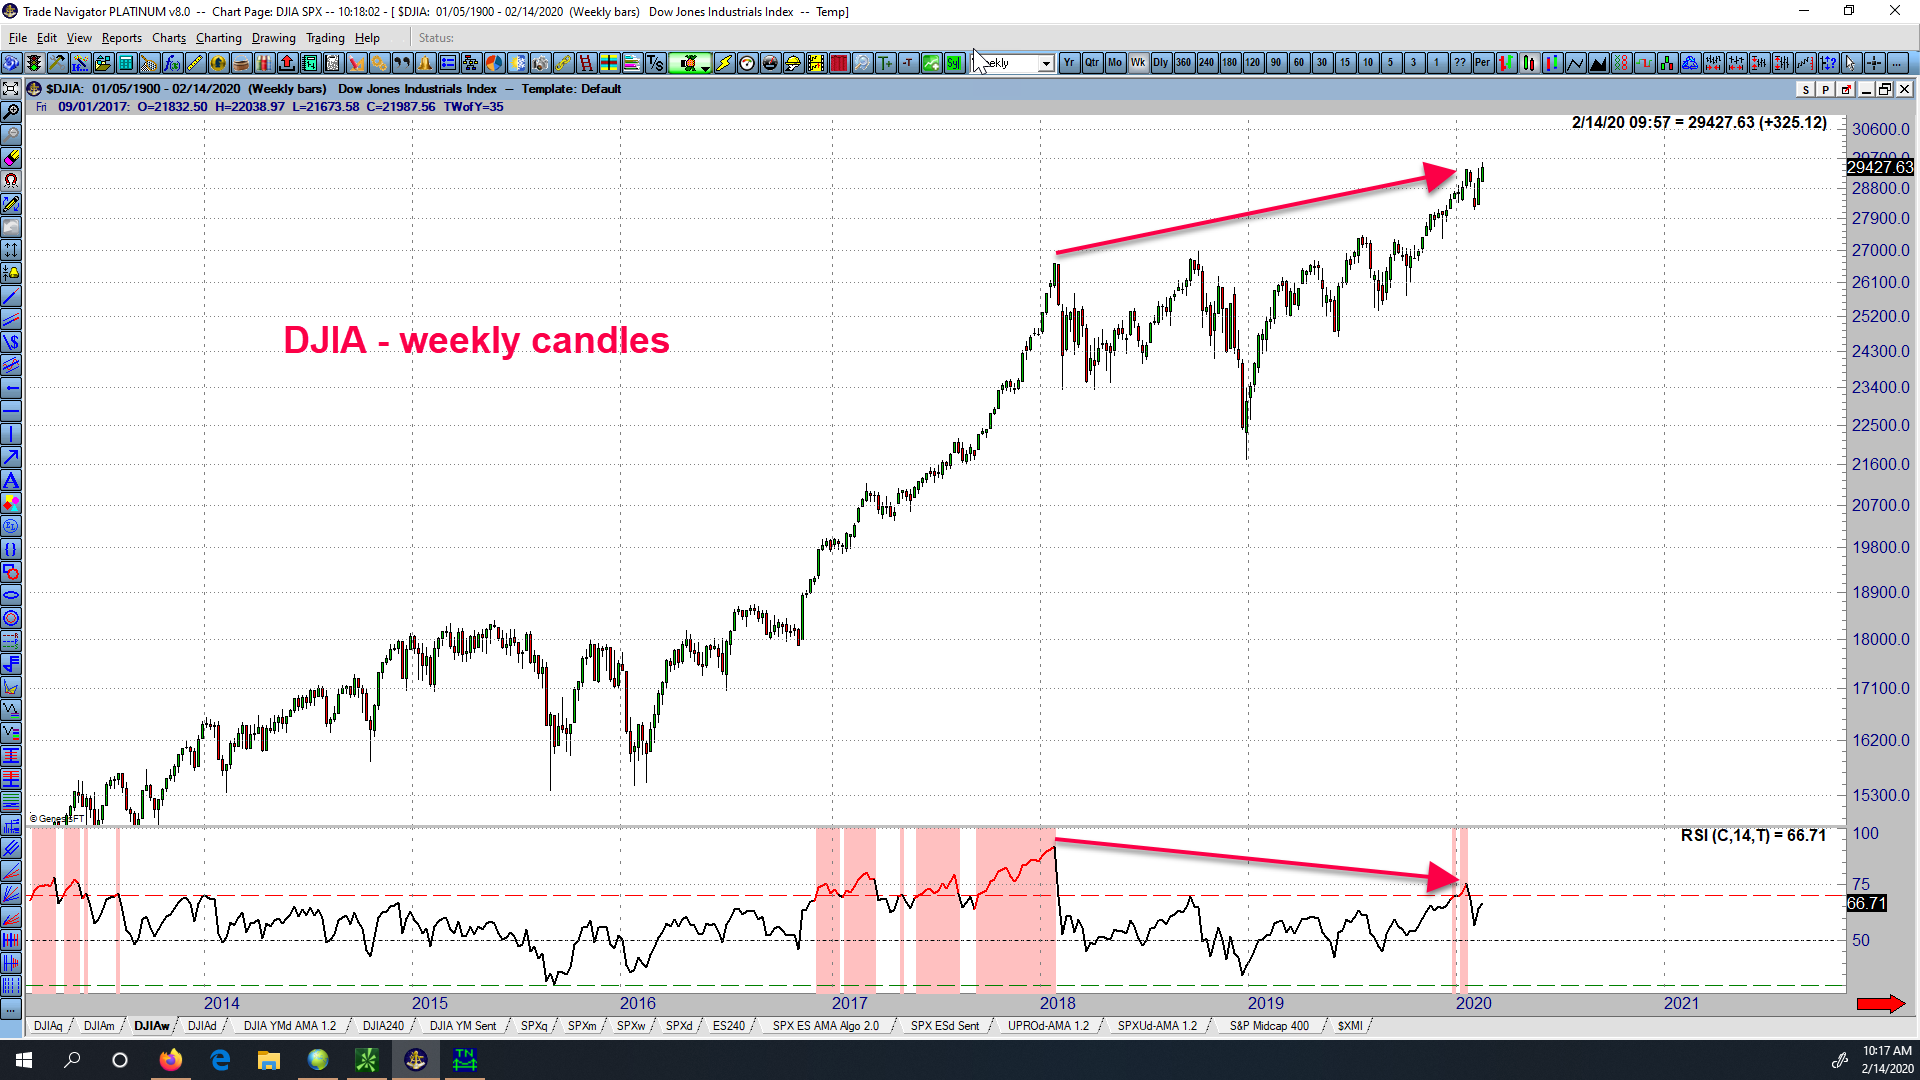
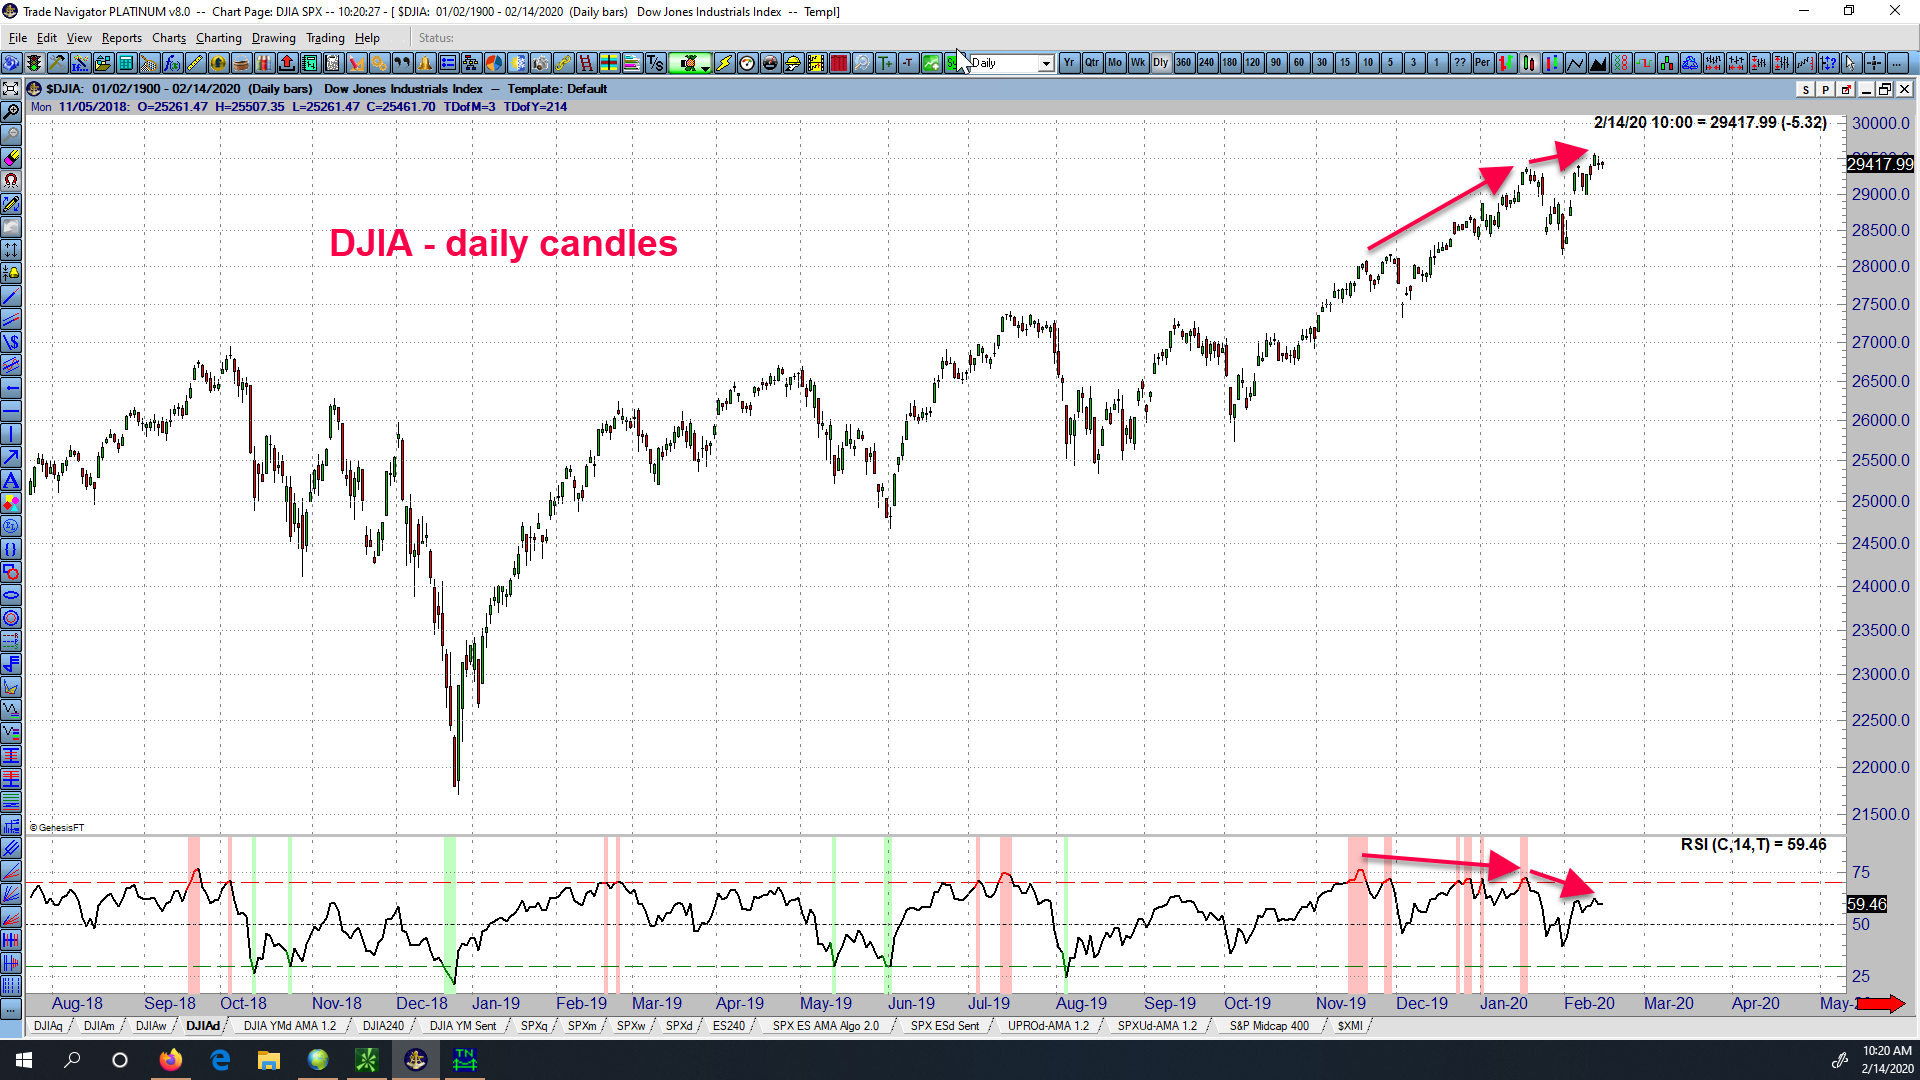
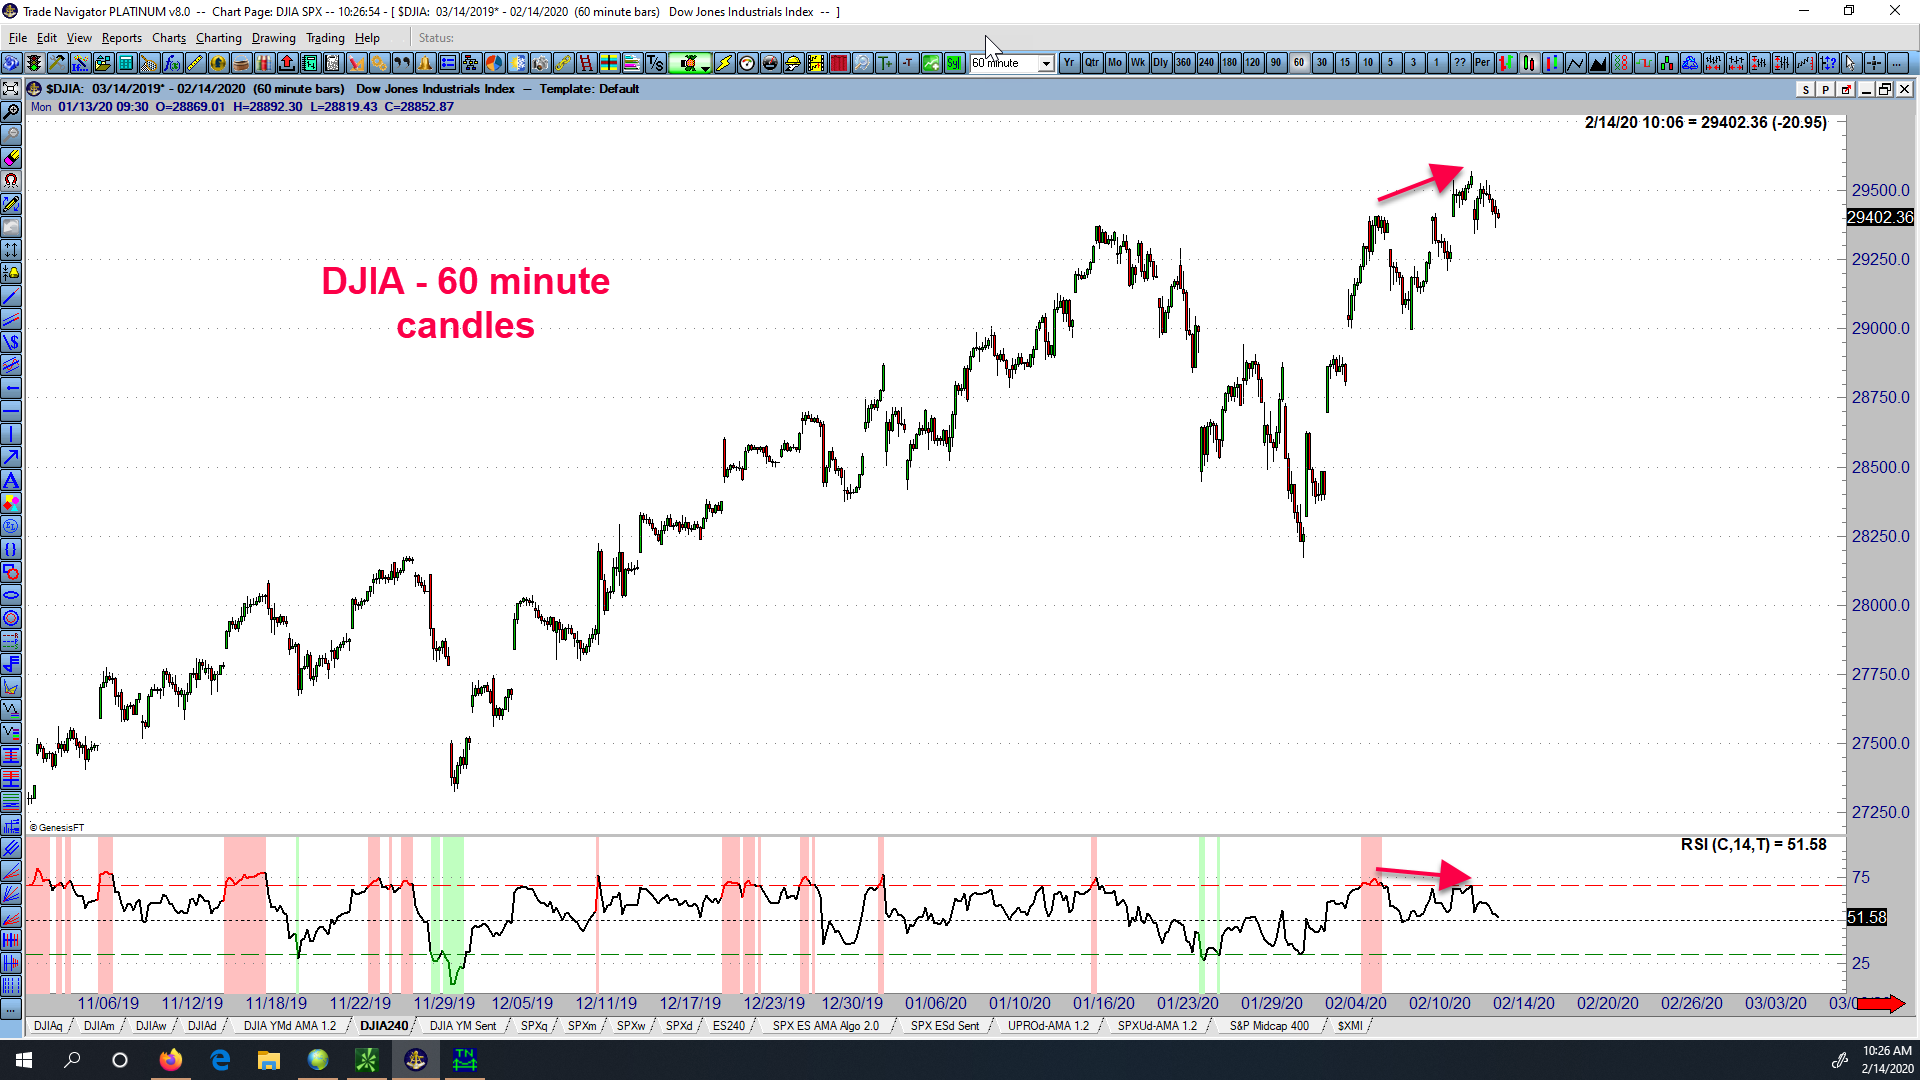
The most publicized stock market indices continue to hover near all-time highs, but is this market losing momentum? The answer is YES. Examine the following multi-timeframe screenshots of the Dow Jones Industrial Average (DJIA) with a standard RSI indicator on the bottom of the screen. The loss of momentum is clearly shown in the form of bearish RSI divergence.
Definition of Bearish RSI Divergence: When price makes a new high, but the RSI indicator fails to make a new high.
Screenshots (click to enlarge):


But what about all the expert calls for more upside?
Despite all the endless bullish talk on financial propaganda TV, this market is showing a clear loss of momentum on ALL time frames. Notice the bearish divergence on the DJIA quarterly, monthly, weekly, and daily charts. There’s even bearish divergence showing on the 240-minute and 60-minute intraday charts. Every single timeframe is showing the same condition, and the Dow is only about 1% off its all-time high as of this writing (Fri, Feb 14, mid-day). While anything is possible, these divergences are a warning sign of a relatively imminent correction, and quite possibly a sizeable one.
If a large correction is about to occur, is there a way to profit from it?
If a sizeable correction is on the near horizon, and you are nearing or in retirement, staying long stocks could be devastating to your nest egg. So how do you combat that? One way is to consider learning how to trade the markets both to the upside and downside. Can market timing be done profitably by individual investors? By combining technical analysis with confirming algorithmic trading signals, we believe the answer is YES. Follow the following links to view videos that explain more about our our methods and services related to confirming algorithmic trading signals:
Our 3-yr Momentum Algo Backtest Results on over 40 Tradeable Items
Momentum Algo In-Depth Explanation Video
Subscriptions:
Sid presents his Elliott wave counts, which include integrated Hurst cycle analysis on over one hundred trade-able items for subscribers (Basic Plan & up) every weekend. He sends out updates on about half of those items every Wednesday. Sid’s unique approach is well worth considering, especially if you’ve never experienced wave labeling and associated Fibonacci price targets that are derived in harmony with independent cycle analysis. Here’s more info about subscribing. There are several different levels of service, including the Crypto and Premium Plans, which feature nightly momentum algo trade signal reports.
Thanks for reading.
(There’s risk of loss in all trading. See the full disclaimer at our site.)
Testimonials:
“Sid, you continue to yield remarkable results – your silver analysis has been nothing short of spectacular this year and I have made enormous profits this year thanks to it. Booked another huge silver profit (this time short) based on your perfect analysis. God has blessed you my friend with great wisdom- thanks for sharing it with others !” – J.F.
“Hey Sid, Yes . . . Count me in as a subscriber to your new service. Impressive display of results today! I’m quite confident it will pick out some incredibly profitable trades, so I look forward to receiving those {nightly} alerts as well.” – D.J.
Click here for many more testimonials spanning the last ten plus years.