Why My Analysis is Different.
Elliott Wave counts and associated Fibonacci price targets are relatively easy for anyone to develop, and it doesn’t take a lot and time and effort to do so. Unfortunately, Elliott Wave (when used alone) invites personal directional bias to enter the equation. The technician can claim (and believe) that they have no underlying bias, but who knows for sure? It’s very much like when someone claims they are not prejudiced. Studies have shown that virtually ALL people harbor at least some characteristics of prejudice and/or stereotyping.
Underlying directional bias is one of the biggest reasons why you’ll often see famous and experienced Ellioitticians disagree on wave counts. Is the analyst inherently an optimist or a pessimist? Is directional bias making its way into their wave counts?
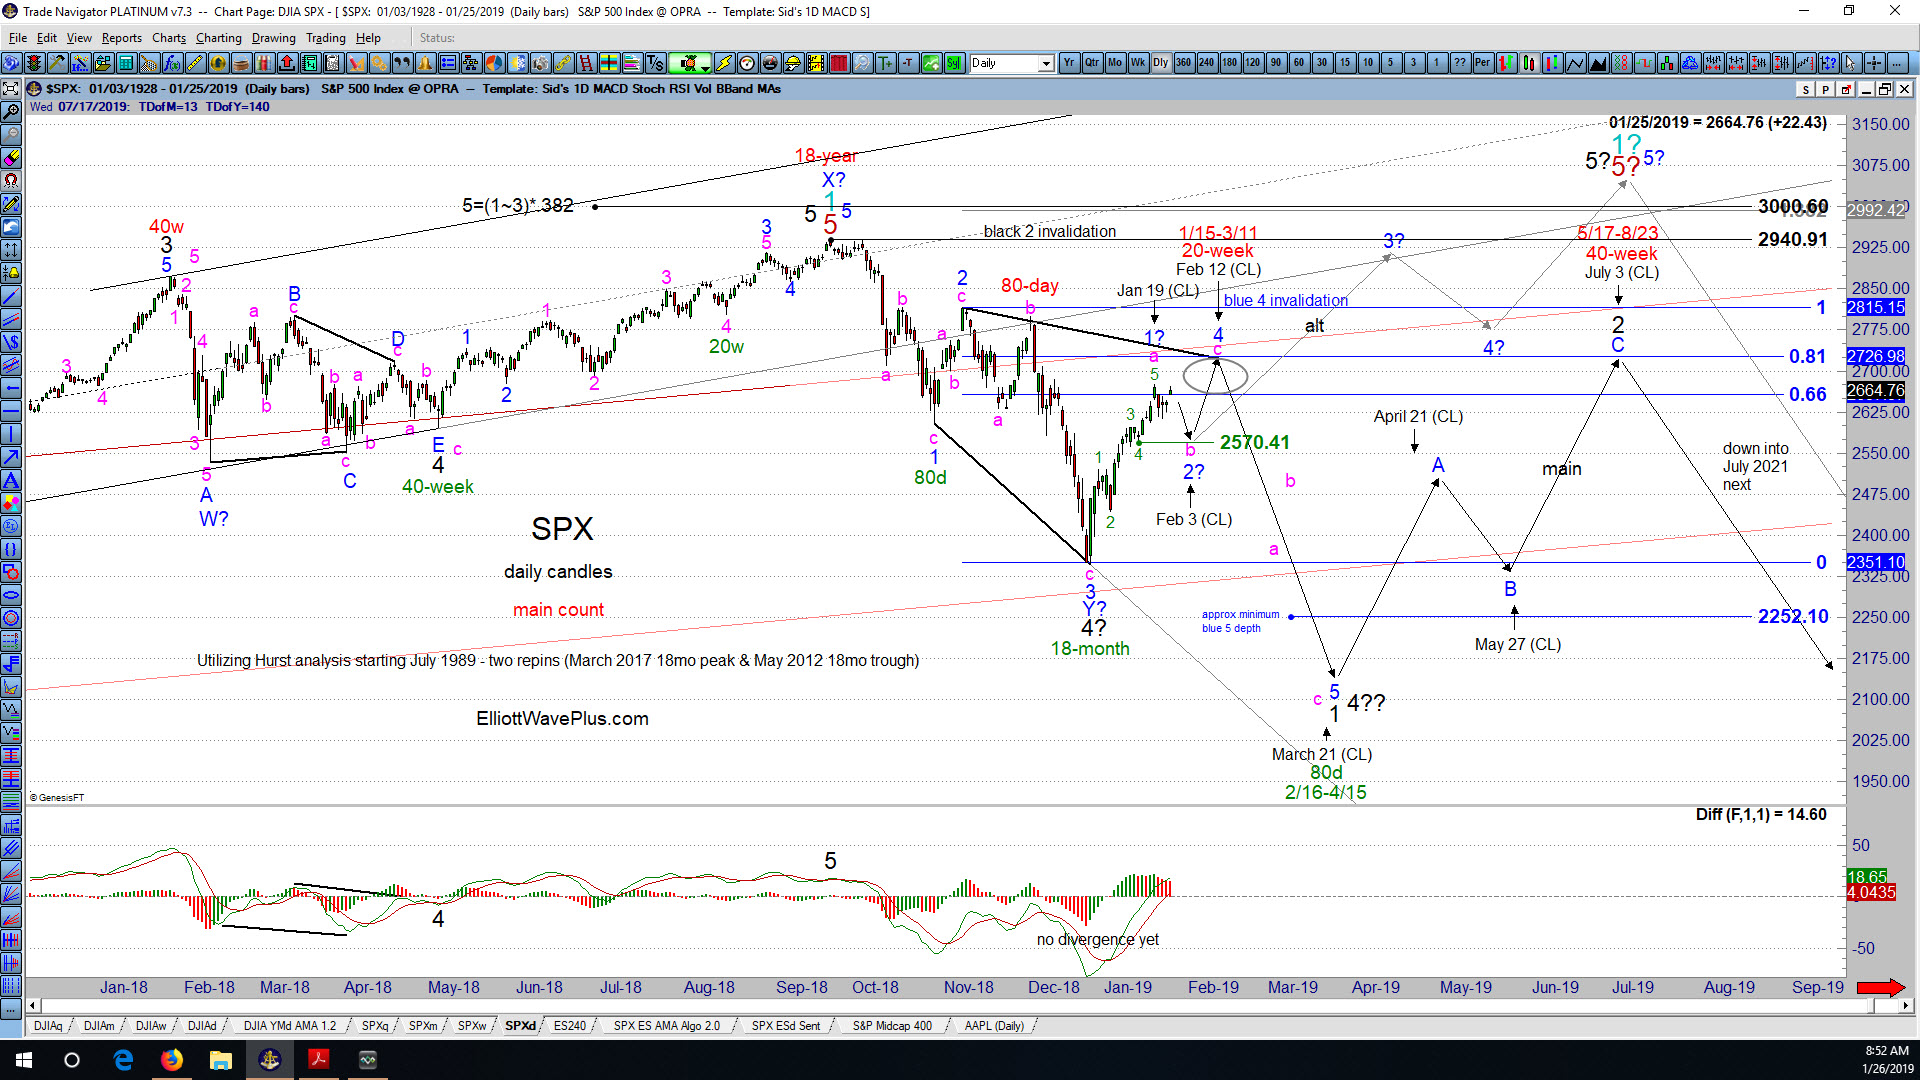
A few years ago, I decided to do something about this problem, and started developing wave counts and associated Fibonacci price targets in harmony with current Hurst cycle analysis. Please consider the following current daily chart of SPX an example of the work I show subscribers every Sunday and Wednesday. (Click on the chart to enlarge)
My Current Elliott Wave Count, and how Hurst Cycle Analysis fits in.
From an Elliott Wave perspective, my top two wave counts are shown. The main count is that an incomplete expanding leading diagonal to the downside is underway starting at the September 21 all-time high. The alternate (shown with question marks) is that an intermediate degree (black) wave 5 to the upside commenced at the December 24 low.
Please note the location of the Hurst cycle peaks and troughs, both past and present. Very importantly, the Hurst Cycle Analysis is labeling the December 24 low as an 18-month cycle trough. That is a large cycle trough, which fits well with the strength of the current rally. Price appears to be moving up impulsively into a 20-week cycle peak, due in about mid-February. That should be followed by downward movement into an 80-day cycle trough due in mid-to-late March. Then, another rally should ensue up through mid-year, into a large, 40-week cycle crest.
One problem with cycle analysis is that it does not inherently address price targets. It generally predicts direction, but how far will price go? In this example, notice that the Hurst analysis is labeling the September high a very large 18-year cycle peak. If that labeling is correct, the 18-year, 9-year, and 4.5-year cycles are all currently pushing down on price. That’s why my main count expects that after the current 20-week cycle peak forms, the subsequent drop into the next 80-day cycle trough could produce a significant plunge.
On the other hand, the upward movement from the December 24 low appears to have carved out a 5-wave structure. I’ve labeled that initial rally a complete pink (minute) wave A of an eventual zigzag. If that count is correct, a pink wave B dip is due, and the final pink wave C to the upside to complete blue wave 4 of the diagonal would have to be quite short in comparison with the length of pink wave A. Why? Because each leg of an expanding diagonal typically retraces the prior leg by 66 to 81%. If blue wave 4 stretches to the 81% retrace target, it will peak very near the 2727 level. I would consider that target to be an extremely important “line in the sand” between the main and alternate counts.
Another important consideration is that short wave C’s to end zigzags are relatively uncommon. This makes the alternate count a legitimate possibility, and the continued rally in the SPX is bringing it more and more into focus. The alternate count (also shown on the chart) expects that a 5-wave impulse to the upside started at the December 24 low, and will very likely end at new all-time highs, topping in about early July this year according to Hurst. Within that 5-wave up structure (in blue), only blue wave 1 would be complete at this time, with blue wave 2 likely underway as a “flat”. Notice that waves in both the main and alternate counts are projected to top and bottom in near harmony with the Hurst cycle analysis moving forward.
A Rare Free Trial.
Prospective subscribers often ask if I offer free trials. Please consider this blog post a rare free trial. Additionally, click here to view my last weekly webinar (from Jan 20), a regular feature of the Pro and Premium Plans.
Thanks for reading, and please consider a subscription! If you have any trouble subscribing for any reason, please email me at [email protected]. I’ll be glad to help.
Sid Norris – https://elliottwaveplus.com/