[vc_row][vc_column][vc_column_text title=”Rethinking the “Trump Stock Rally“”]Market watchers have widely credited Donald Trump’s election victory for the late 2016-early 2017 rally in stocks.
As reported by CNNMoney, the market had shot up nearly 1,600 points between election day and the end of the first trading day of 2017, and it was up 13% for 2016 overall. Some investors speculate that the new president’s tax and regulatory reforms, along with anticipated infrastructure spending, have spurred a wave of euphoria on Wall Street.
Market technician and forecaster Sid Norris of ElliottWavePlus.com has a different take.
As far back as the first quarter of 2016, Sid was anticipating a fourth quarter cycle trough followed by an end-of-year rally — regardless of the election outcome. His prediction was based on a careful analysis combining Hurst cycle analysis with Elliott Wave and other powerful methodologies.
What Is Hurst Cycle Analysis?
JM Hurst was an American engineer in the 1960s and ‘70s, who pioneered the use of computers to study historical movements of the US stock market. Through his research, Hurst discovered multiple cycles acting on all trading markets at all times.
- These cycles range in length from an average of 18 years to 5 days.
- The Hurst cycles overlap and combine to influence price movements.
- Prices tend to go up when the majority of cycles are pushing to the upside.
- Conversely, prices tend to fall when the majority of cycles are pushing lower.
- When most of the cycles align in directional pressure, the result can often be seen in the form of fast, one-directional markets.
- A synchronized trough occurs when multiple cycles are trending down at once. This generally creates an excellent buying opportunity.
- Hurst devised a nominal model based on the different cycles acting on the markets:
| 18-year cycles
9-year cycles 4.5-year cycles 18-month cycles 40-week cycles 20-week cycles |
80-day cycles
40-day cycles 20-day cycles 10-day cycles 5-day cycles |
- Thanks to technology, there’s no need for the average trader to memorize the ins and outs of every cycle. A software tool called Sentient Trader assists traders who want to include Hurst cycle analysis in their decisions.
What Do Hurst Cycles Have to Do with the Post-Election Rally?
Sid used Hurst cycle analysis, along with Elliott Wave and other powerful technical analysis methodologies to identify a large degree cycle trough of at least 40-week magnitude in the first quarter of 2016.
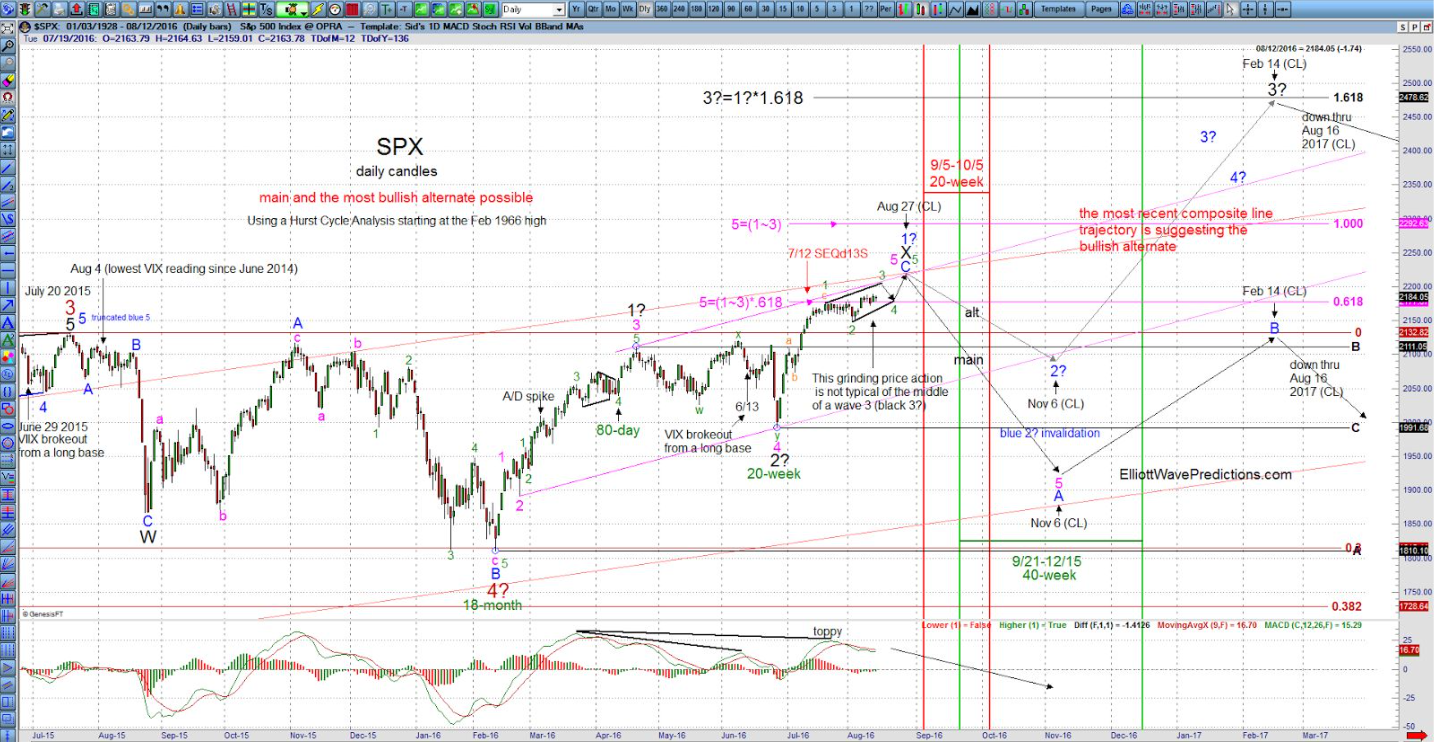
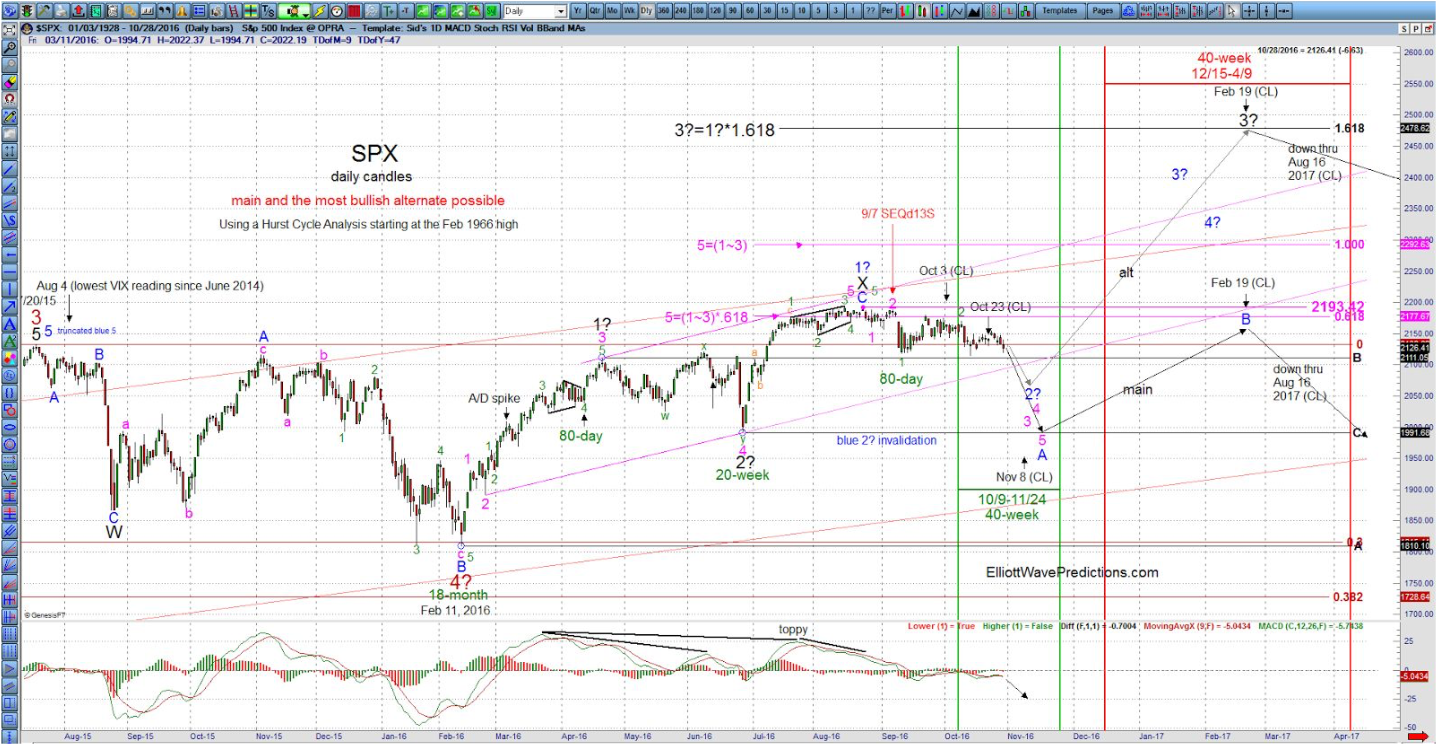
- Once the February trough was confirmed, Sid correctly anticipated that the next 40-week cycle trough would occur in late October/early November 2016.
- For many weeks prior to the election, Sid informed his Weekly “Counts” Webinar (Pro Plan) subscribers that once the early November 40-week cycle trough occurred, it would be followed by a rally through the end of 2016, and likely continuing into February 2017, potentially achieving new all-time highs in the process.
- As the election neared, the “composite line” feature in Sentient Trader software was pinpointing November 8 as the most likely day that the 40-week cycle trough would occur.
- The strong rally that many associate with Trump’s victory would therefore have played out regardless of the election outcome in early November.
The screenshot below was provided to ElliottWavePlus.com’s Pro Plan and Basic Plan subscribers on August 14, 2016:
And the following screenshot was provided to subscribers on October 30, 2016:
These examples illustrate how subscribers to ElliottWavePlus.com benefit from Sid’s approach of combining Hurst cycle analysis with Elliott Wave and other well-established methodologies to add powerful insights to your trading strategy.[/vc_column_text][/vc_column][/vc_row]


