Sid’s Current Algo Statistics and Results (November 2019 Edition)
The sort-able Excel spreadsheet:
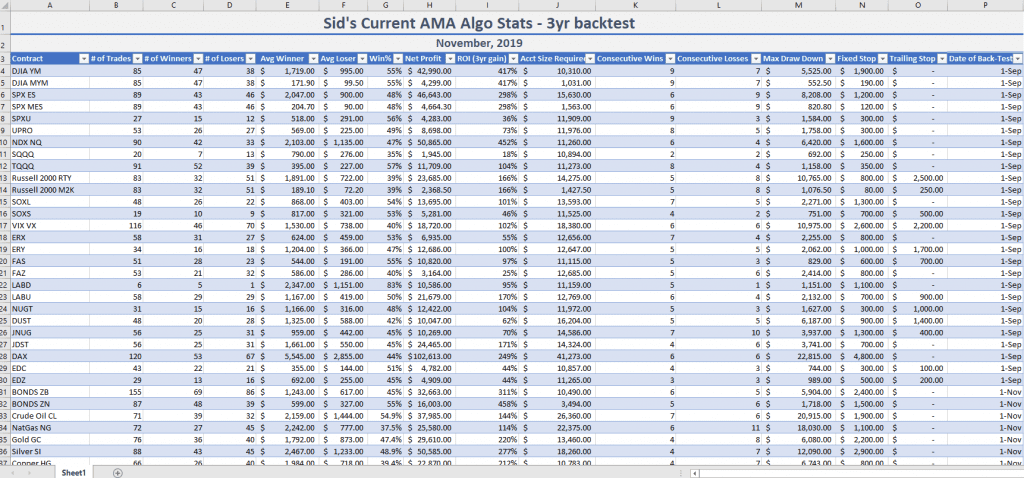
Each month, we prepare a downloadable and sort-able excel spreadsheet and send it out to our email list. This spreadsheet shows three-year back-tested trading results of our proprietary Premium-Plan momentum algo on over forty seven trade-able items. The November 2019 monthly Algo summary spreadsheet can be accessed below.
Premium Plan subscribers receive Nightly Reports providing notification of these trades, along with trade-management instructions such as stop placement and exit signals. Our signals are based on daily charts, so there is no need for Premium Plan subscribers to be glued to intra-day charts. Every evening, Premium-Plan subscribers also receive a PDF that summarizes trade positioning, in addition to screenshots of every Algo Signal Chart and every Sentiment Conditions Chart on each of the top performing twenty items from the monthly spreadsheet.
The monthly sort-able spreadsheet currently covers 47 different items, each showing the number of:
Trades, Winners, Losers, Average Winner, Average Loser, Win Percentage, Net Profit, Return on Investment, Account Size Initially Required, Consecutive Wins, Consecutive Losses, Max Close-Out Draw-down, Fixed Stop-Loss Size, and Trailing Stop Size (if utilized on that item).
A glimpse of the trading results: (click to enlarge)
Education:
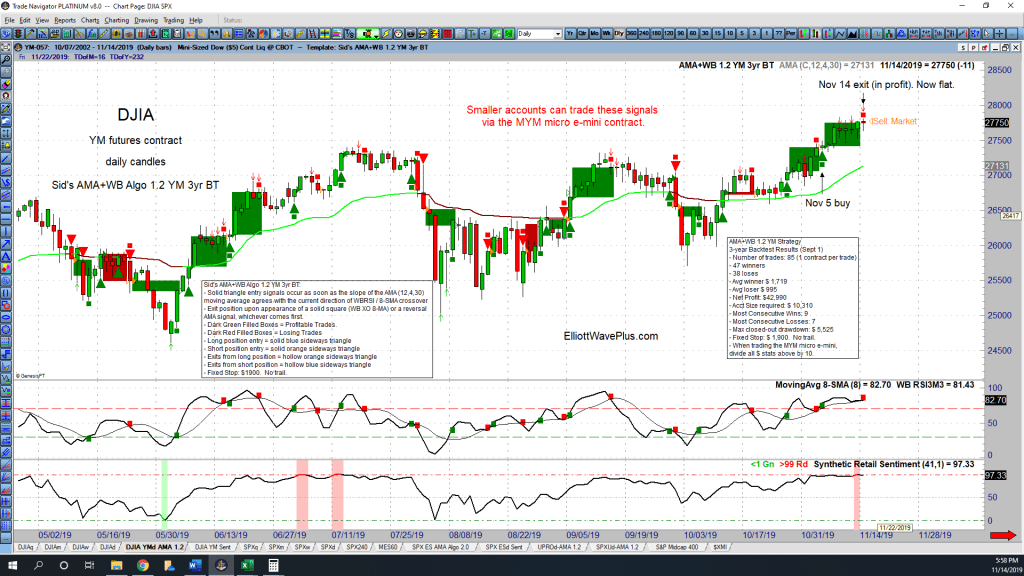
The carefully constructed algorithms are based on a variety of strategies including retail sentiment and multiple momentum indicators. The benefit to these automated trade signals is the unbiased opinion they provide based on current technical conditions. These indicators may suggest a buy or sell upon the close any daily candle. Our proprietary momentum algo performs especially well on items that have a tendency to trend. A good example of this would be Dow Jones Industrial Average (DJIA): (click to enlarge)
As you can see from the DJIA chart above, there was a buy signal on November 5th. You can see there was a green triangle pointing to the upside on that day. Premium-Plan subscribers would have been notified of an automated trade signal to buy the same evening, so they could put on a position if they saw fit. The algo stayed in that trade for five days, exiting the long position based on loss of upside momentum on November 14, in profit. The red square above the candle on the 14th is the indicator to exit the trade. The big green boxes on the chart represent prior winning trades. The small red boxes represent prior losers. Notice that the winning trades were allowed by the the algo to “run”, and sometimes were quite large, whereas the losing trades were always cut relatively short, having been limited in size by the algo settings.
We suggest looking at Sid’s Elliott Wave counts in conjunction to the Nightly Algo Report signals. Many subscribers will only take trades that “agree” using all of these methods of technical analysis. Improved winning percentage could result.
The Bottom Line:
By combining robust methods of technical analysis (Hurst cycle analysis, Elliott wave theory and its associated Fibonacci price targets, extreme sentiment positioning, algorithmic trade signals based on momentum, indicator divergences, etc.), problem-solving power is increased, providing higher confidence trading opportunities.
Download the Sort-able Spreadsheet of 3-year momentum algo back-test results on over forty items:
Testimonials:
“Hi Sid, I’m a young trader, new to the world of forex trading. I’ve viewed some of your postings and they are quite amazing! Your analysis covers all the essential rules and guidelines of the wave principle that I’ve had such a hard time grasping until now. Thanks for your help and support.” – S.H.
“I’ve been trading these markets (and subscribing to professional services) for more than forty years and find your work and resulting forecasts, targets, objectives, etc. to be free of personal bias, and remarkably accurate. That is why I continue to subscribe. Well done.” – W.M.
Click here for many more testimonials spanning the last ten years.
How to Subscribe
Please consider a subscription! Just head over to Elliott Wave Plus and be sure to check out the free resources. If you have questions regarding subscription, please email me at [email protected]. Thanks for reading.
Sid Norris – https://elliottwaveplus.com/
(There is risk of loss in all trading. See the full disclaimer at our site.)


