The Current State of the US Stock Market, the US Dollar, and Gold. A free blog post by Sid Norris of ElliottWavePlus.com
A lot has happened in the stock market since my last post in late January. But not so much in the Dollar and Gold. Here’s a quick survey of my current Elliott Wave and Hurst Cycles analysis on the S&P-500, the US Dollar Index, and Gold.
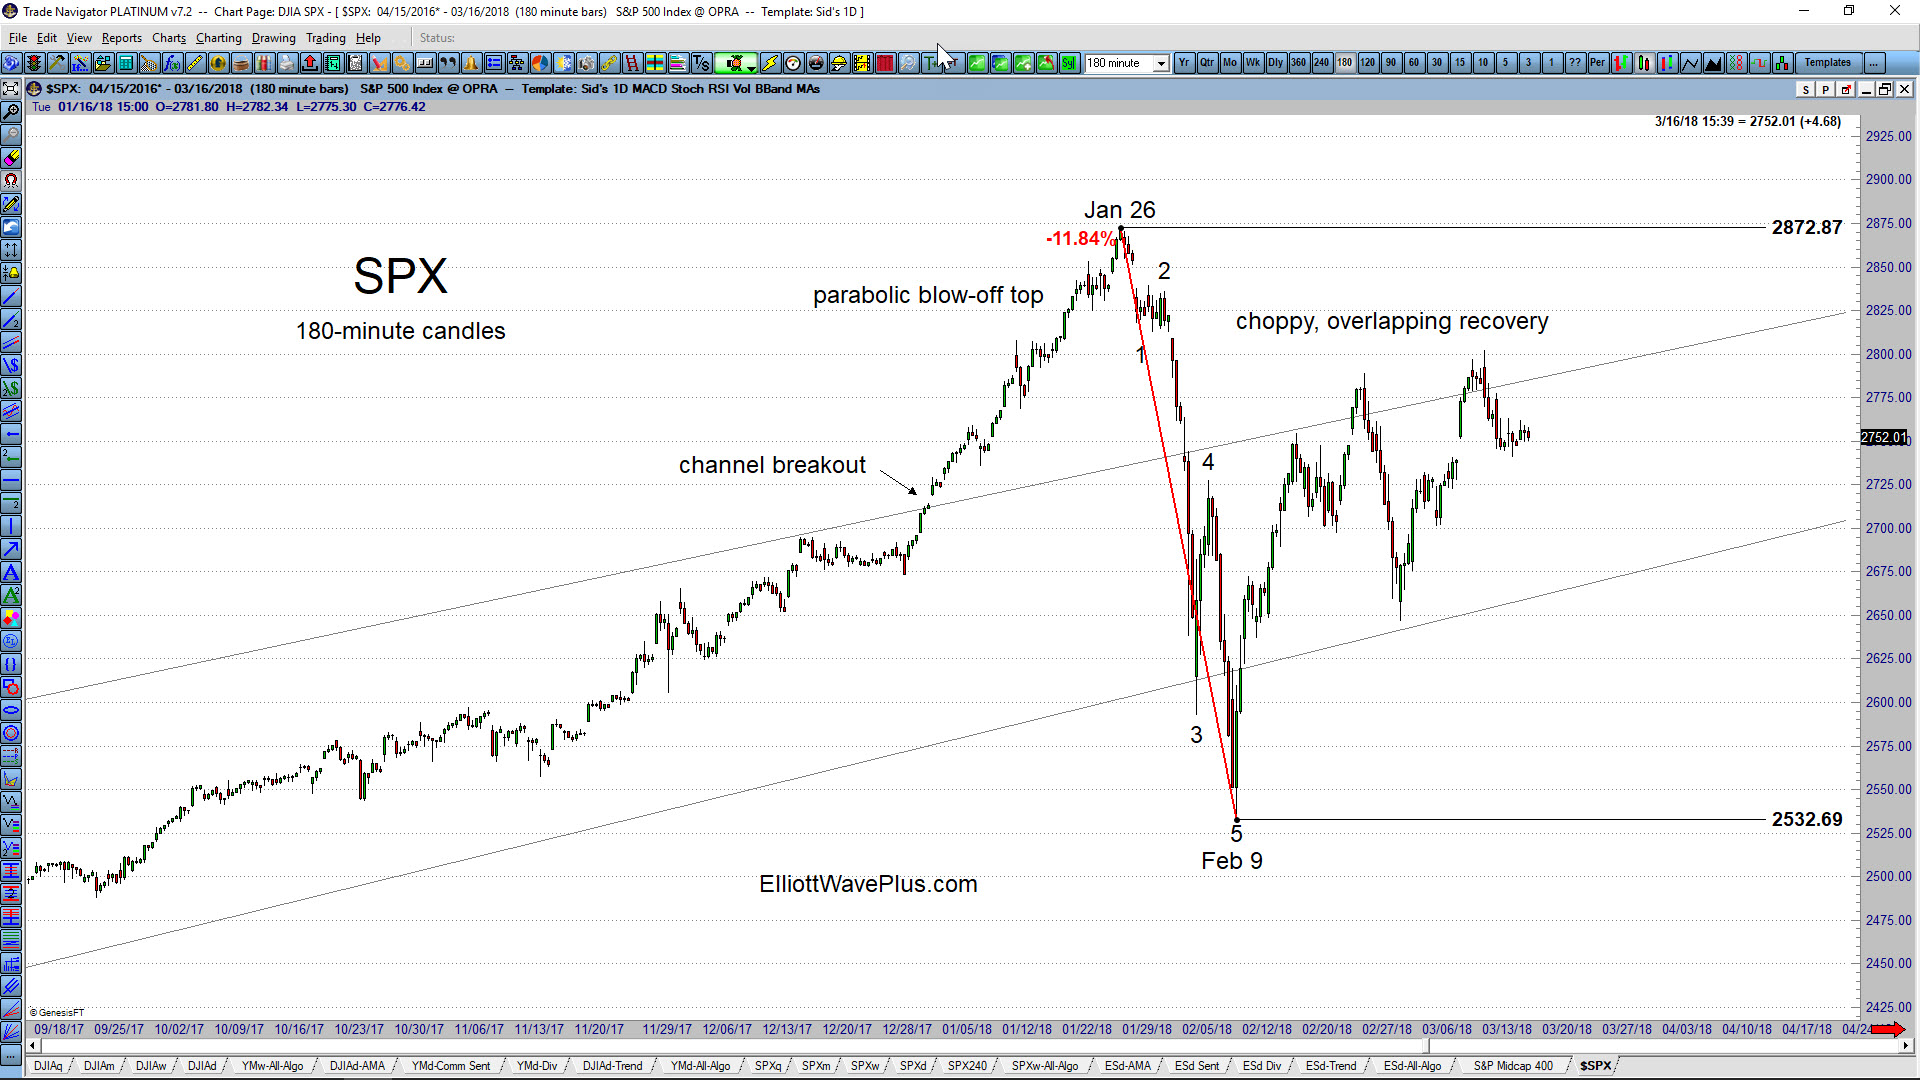
The S&P-500:
The January rise in the US stock market went parabolic before topping on January 26. The 11.84% drop over the next 2 weeks (thru February 9) carved out a clear 5-wave impulse to the downside. The recovery so far appears to be choppy, overlapping, and corrective. From an Elliott Wave perspective, the aggressive move down thru Feb 9 is therefore very likely to be a wave 1 of a new downtrend, or a wave A within a 4th wave zigzag. Therefore, another 5-wave wave structure to the downside, taking out the Feb 9 low of 2532.69 would be a high probability expectation.
Also possible within Elliott Wave theory is that the drop from Jan 26 thru Feb 9 was wave A within a wave 4 triangle. Only 4 of the 5 legs of a triangle are required to be a zigzag or zigzag combination. One of the legs can be something else, including a 5-wave impulse.
So there are several possible scenarios within Elliott Wave theory, which is almost always the case. Here at ElliottWavePlus.com, we bring in Hurst cycle analysis to assist in determining which Elliott Wave pattern will be considered the “main count”. Currently, a Hurst cycle analysis on SPX, using Sentient Trader software, starting at the year 1966 high projects the Jan 28 high to be a 9-year cycle peak. The composite line suggests some sideways chop before the markets move substantially lower, initially into the year 2020, and eventually bottoming in 2024.
A similar analysis of the Dow Jones Industrial Average starting at the year 1928 high suggests that the January 2018 high was an 18-year cycle top, which is the largest cycle that Sentient Trader can designate. The long-term composite line roadmap moving forward is virtually identical to the one described in the SPX analysis above.
All of this suggests that the SPX and Dow Jones Industrial Average will carve out a series of nested 1-2’s starting at the late-January high before the market breaks down. This is quite typical of the way stock markets top. Tops are rounded, and bottoms are V’s. The Sentient Trader composite line suggests that the sideways chop will last a bit longer, and subscribers to paid plans at ElliottWavePlus.com will be made aware of exactly when the more aggressive breakdown is due to start.
The US Dollar Index:
In my last free post (on Jan 30), I covered the US Dollar Index, and amazingly, little has changed. The Dollar appears to be involved with a bottoming process. A large cycle trough has been due, and the date-window for that trough is fairly wide. While an interim bottom may be “in”, the sideways chop over the past several weeks counts best internally as corrective, and a typical Fibonacci target for the 5th wave down from the Jan 2017 high hasn’t quite been hit yet. Whether the bottom is in or not, the Sentient Trader (Hurst cycles) composite line currently suggests a bounce in the US Dollar into approximately June 2018. It also suggests that after that bounce, aggressive downward movement in the Dollar will resume.
Gold:
Gold, Silver and the precious metals miners have generally been moving sideways since mid-2016. For most Elliotticians, it’s been a difficult period, as the sideways corrective structure since mid-2016 has extended, lasting longer that most expected. My custom 7.4-year, 2:1 ratio (top-to-bottom) cyclic model, which I programmed into Sentient Trader software has generally done a very serviceable job of projecting each of the small peaks and troughs over the last couple of years. That model, when simultaneously considering the Hurst analysis of the US Dollar Index, continues to expect sideways movement in the precious metals for a bit longer, probably ending in a capitulation-style move to the downside before this sector can move substantially higher. That low is very likely to be accompanied by extremely low retail sentiment, as well as large commercials (producers) going all-in long. Subscribers to my paid plans will be made aware of the projected date window of that coming low, as well as the most likely date for the low, the most likely Fibonacci price for that low, as well as the sentiment spread condition between retail and large commercials prior to that low.
Please consider a subscription to one of my paid services. Thanks for reading.
Sid Norris – ElliottWavePlus.com