Technical Analysis of the CRB Index (the Commodities Complex) by Sid Norris from ElliottWavePlus.com.
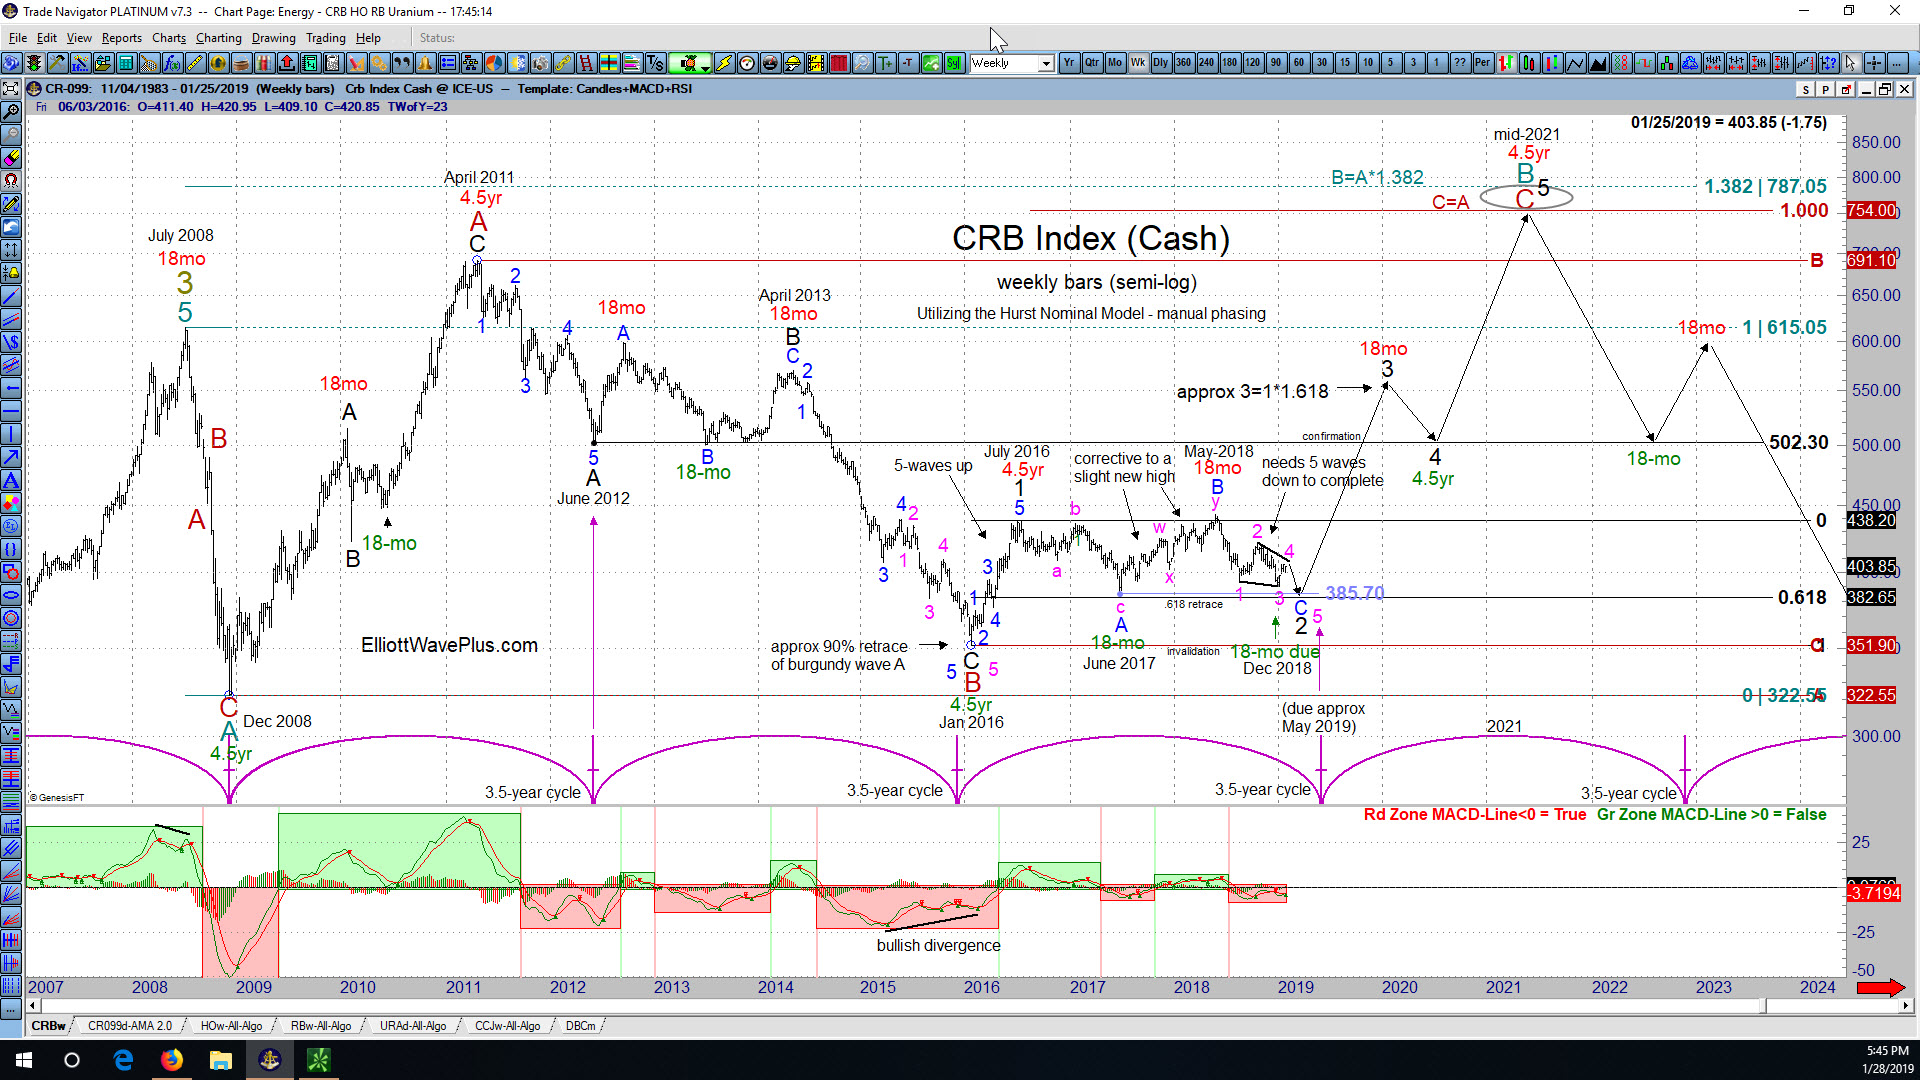
The weekly chart (below) of the CRB Index (cash) shows my main Elliott wave count and associated Fibonacci price targets, as well as Cycle analysis, utilizing both the Hurst system and a custom 3.5-year model. (Click on the chart to enlarge).
Elliott Wave Count
My main wave count on the CRB Cash Index shows a super-cycle (olive) wave 3 designation at the July 2008 high, followed by a 3-wave structure to the downside into Dec 2008, labeled cycle (teal) wave A. That was followed by a clear 3-wave up structure into the April 2011 all-time high. Any time you see a 3-wave structure terminate at an all time high, it is either the 5th wave of an ending diagonal (which is definitely not the case here), or wave B of a ongoing triangle (which is still a possibility in this case), or all or the first leg of a B wave. Because the move up from Dec 2008 through April 2011 was deeply retraced in 3-waves by almost exactly 90%, I’ve labeled the April 2011 high as primary (burgundy) wave A, and the Jan 2016 low a completed burgundy wave B of an ongoing, unfinished expanded flat. This would mean that burgundy wave C to the upside started at the Jan 2016 low, and is very likely to end above the 2011 high. There are two Fibonacci price targets, both in new all-time-high territory for the end of burgundy wave C, and therefore teal wave B. Burgundy C will equal burgundy A at 754, and just slightly higher than that, teal wave B will reach a very normal 1.382 times teal wave A at at 787.
Burgundy wave C to the upside should subdivide into 5 intermediate (black) waves. Black wave 1 to the upside ended in July 2016, and internally subdivided nicely into 5-waves. That was followed by 3-waves down into June 2017 (blue A), then a corrective double zigzag to a slight new high in May 2018 (blue B), which leaves us with the expectation of a 5-wave structure to the downside, likely ending slightly below the June 2017 low of 385.7, to complete blue wave C and a “flat” for black wave 2. There is also a common retrace target nearby at 382.65, where black wave 2 will have retraced black wave 1 by .618. Those final 5-waves down are labeled in pink, with waves 1, 2, 3 and 4 about finished. All that remains is a pink wave 5 to the downside to complete the downward structure since the May 2018 high, which I’m counting as a nearly finished ending contracting diagonal.
Cycle Analysis – Two Ways
Hurst cycle analysis, which is typically my “go-to” cyclic analysis method is shown on the chart with 4.5-year and 18-month cycle peaks shown in red, and troughs in green. Hurst suggests that the Jan 2016 low was the last 4.5 year cycle trough, and shortly after that, the July 2016 high was the last 4.5-year cycle peak. Interestingly, the downward movement from that large cycle peak in mid-2016 has been sideways in nature, which suggests that the Jan 2016 low may also have been a 9-year cycle trough. Based on that same Hurst cycle analysis, there was an 18-month cycle trough in June-2017, so the next 18-month cycle trough was due in or around Dec 2018.
Also shown on the chart (in purple), is a custom (non-Hurst) cyclic analysis of troughs, which appear to be bouncing in a regular 3.5-year rhythm. The first trough shown in the series was in Dec 2008, and the next was in June 2012. Each subsequent trough shown on the chart is based on a extrapolated continuation of that initial 3.5-year duration. The Jan 2016 was just one month late in forming, which is within acceptable allowance. The next 3.5-year cycle trough is due in about May 2019. When I average the expectations of the Hurst and custom 3.5-year cyclic models, a large cycle trough will likely occur late in the first quarter of 2019. That expectation fits very nicely with my Elliott wave count as shown on the chart and explained above. Notice that both the Hurst and 3.5-year models suggest that the next large cycle peak is due in the year 2021.
What does all this mean for the US Dollar and the stock market?
If we’re going to see commodity inflation kick in this quarter and continue through mid-2021 as the chart suggests, the US Dollar is very likely to move strongly lower during the same period. As for the general stock market, I suspect that most economists would expect it to move higher right alongside commodities, unless there’s a bout of 1970’s style stagflation, which happened so long ago now that almost no one considers it a possibility anymore. One must consider though, stocks are still quite high in comparison with their 2011 levels, while almost all commodities are substantially lower than their 2011 highs. Did anyone predict that commodities would tank from 2011 through 2016 while also predicting that stocks would roar higher? Food for thought . .
—
Thanks for reading, and please consider a subscription! If you have any trouble subscribing for any reason, please email me at [email protected].
Sid Norris – https://elliottwaveplus.com/