Dow Jones Industrial Average | Comprehensive Technical Analysis

Dow Jones Industrial Average – Comprehensive Technical Analysis
Today’s video post is an excerpt of our January 2, 2022 weekly Counts webinar for Pro and Premium Plan subscribers at ElliottWavePlus.com. This excerpt consists of Sid’s highly detailed coverage of the Dow Jones Industrial Average. Sid starts by showing a cluster of several long-term Fibonacci targets in the 41-44K range on the Dow.
Sid explains that all this market needs to produce that grand Supercycle wave 3 top is a completed 5-wave structure up from the March 2020 low into that long-term target range. At this juncture, it appears that a 5-wave non-overlapping impulse is well underway from that March 2020 low. Hurst cycle analysis is current projecting that a major top will occur in the Dow in approximately late-May 2022. The Hurst projected top on the highly correlated S&P-500 is a little later, in late-Sept 2022.
GDX Miners Call 2021
GDX miners coverage 2021. In mid-November of 2021, there was a flood of articles being published around the internet that were extremely bullish gold, silver and the precious metals mining stocks. We know that at the time, there were also numerous self-professed Elliott Wave gurus preferring bullish wave counts. Sid’s use of Elliott Wave and Hurst allowed him to project an accurate GDX roadmap for subscribers.The key to our GDX roadmap was the expectation of a 20-week Hurst cycle PEAK in mid-November. Just as the masses were screaming “GOLD BREAKOUT!”, we were expecting a reversal.Check out the video, which is a great example of Sid’s typical weekly “counts” webinar coverage. Keep in mind, this is coverage over one specific item. Sid goes into detailed analysis on dozens of items every single week.
XLE Call
Then, more recently, during his August 22, 2021 weekend “Counts” webinar, Sid suggested that the correction since March in XLE had likely ended, and that large-cap oil companies should rally once again for several months, this time out of a larger 18-month Hurst cycle trough. As of today, XLE is up 31.61% from its August 19, 2021 low.
The Outcome
To put this into perspective, had subscribers bought $10,000 worth of XLE at the open on November 2 ($29.11), and closed that position upon the first appearance of a deeply overbought pink exhaustion stripe on our daily charts (at $52.20 open on March 10, 2021), that 10K would have turned into $17,932, a profit of $7,932. Additionally, had subscribers bought $10,000 worth of XLE at the opening price of $47.00 on August 23, and held until the first pink exhaustion stripe occurred, taking profit at $57.62 on October 22, that would have turned the $10K investment into $12,260, an additional profit of $2,260. Total profit by these two example trades? $10,192. Not too shabby!
Our question for you is, if you aren’t a current subscriber, why not?
The Premium Plan consists of:
Nightly screenshots on over 20 trading instruments (stock index futures, commodities, currencies, bonds, etc.), showing the most recent momentum buy/sell signals, change stop to trailing indicators, and/or exit trade suggestions. Please visit ElliottWavePlus.com to see the full list of items covered.
Sentiment positioning on all items that contain sentiment data.
A nightly summary report including algo signals, sentiment conditions, Sid’s Elliott wave roadmap, and Hurst Cycle analysis on twenty items.
A nightly email letting subscribers know that today’s signals are available to view and download.
You’ll also be able to download a sortable excel spreadsheet showing the most recent 3-year backtest results. This sortable chart shows everything!
Gold Mining Stocks – GDX Traded with Precision Timing

On March 28, 2021, Sid published the above chart of GDX for Elliott Wave Plus Basic Plan, Pro Plan, and Premium Plan subscribers:
Sid’s roadmap had GDX ready to bottom in early April, rally through late May, and then pull back sharply into a large Hurst cycle trough due in mid-August. His late-March 2021 main Elliott wave count predicted that the correction that had been underway in GDX since the early August 2020 high would eventually unfold as a WXYXZ triple zig-zag, likely ending in mid-August 2021, in harmony with the Hurst cycle analysis at the time.
The chart below is a current GDX weekly (through Sept 13, 2021):
This has been our challenge at Elliott Wave Plus, and we have alerted subscribers to several buying opportunities in undervalued sectors on the verge of ripping higher over the past year. We have posted YouTube videos of a couple of these timely alerts over the past year.
The first was our call to buy XLE (the large cap oil companies) in late October 2020. (See the post and video here). XLE more than doubled over the following 4.5 months. At the time that we made that call, famous talking heads on financial propaganda TV were vehemently recommending avoiding the sector. The second was our call to buy stocks in the shipping sector in early November 2020. (See the post and video on the shipping sector here.) Many, many stocks in that sector have more than doubled since then as well. In both examples, the sectors were at exceptionally low junctures after being beaten down for an extended period, and almost no one was talking about them.
In this post, we will show you another sector buying opportunity that we pointed out to subscribers in late March of this year. GDX (the Gold Miners ETF) has been up as much as 16+% so far since our mid-week (March 31) EWP ScreenShot (for Basic Plan and up subscribers) suggested an imminent turn to the upside. That suggestion that GDX would rally came after the precious metals sector endured seven long months of downside chop. Many of the companies in this recently neglected sector have been nicely profitable all through that multi-quarter correction, so bargain valuations have been easier to find here than in most other sectors.
The question is, does this rally have legs, or is it already done? There are many technical aspects we are actively looking at for clues, including a potential bullish 1-2-1-2 wave count from the early-March low, combined with the expectation of future peak and trough dates based on Hurst cycle analysis. We will keep our subscribers aware of our projected future roadmaps on GDX in addition to many tradable items with EWP ScreenShots of our analysis every Sunday and Wednesday (Basic Plan), as well a multi-hour weekly Sunday video (Pro Plan), excerpts of which were used to produce the YouTube video featured in this post.
Also shown in the attached video is a potential trade signal and associated multi-indicator setup produced by our proprietary momentum algo on GDX. Our Premium Plan provides screenshots and automated momentum trade signals on twenty popular items every night. Many of our subscribers use these nightly signals as confirmation of our proprietary analysis based on a combination of Elliott wave and its associated Fibonacci price targets, as well as Hurst cycle analysis.
Sid’s Recent Call on GDX (Gold Miners ETF)
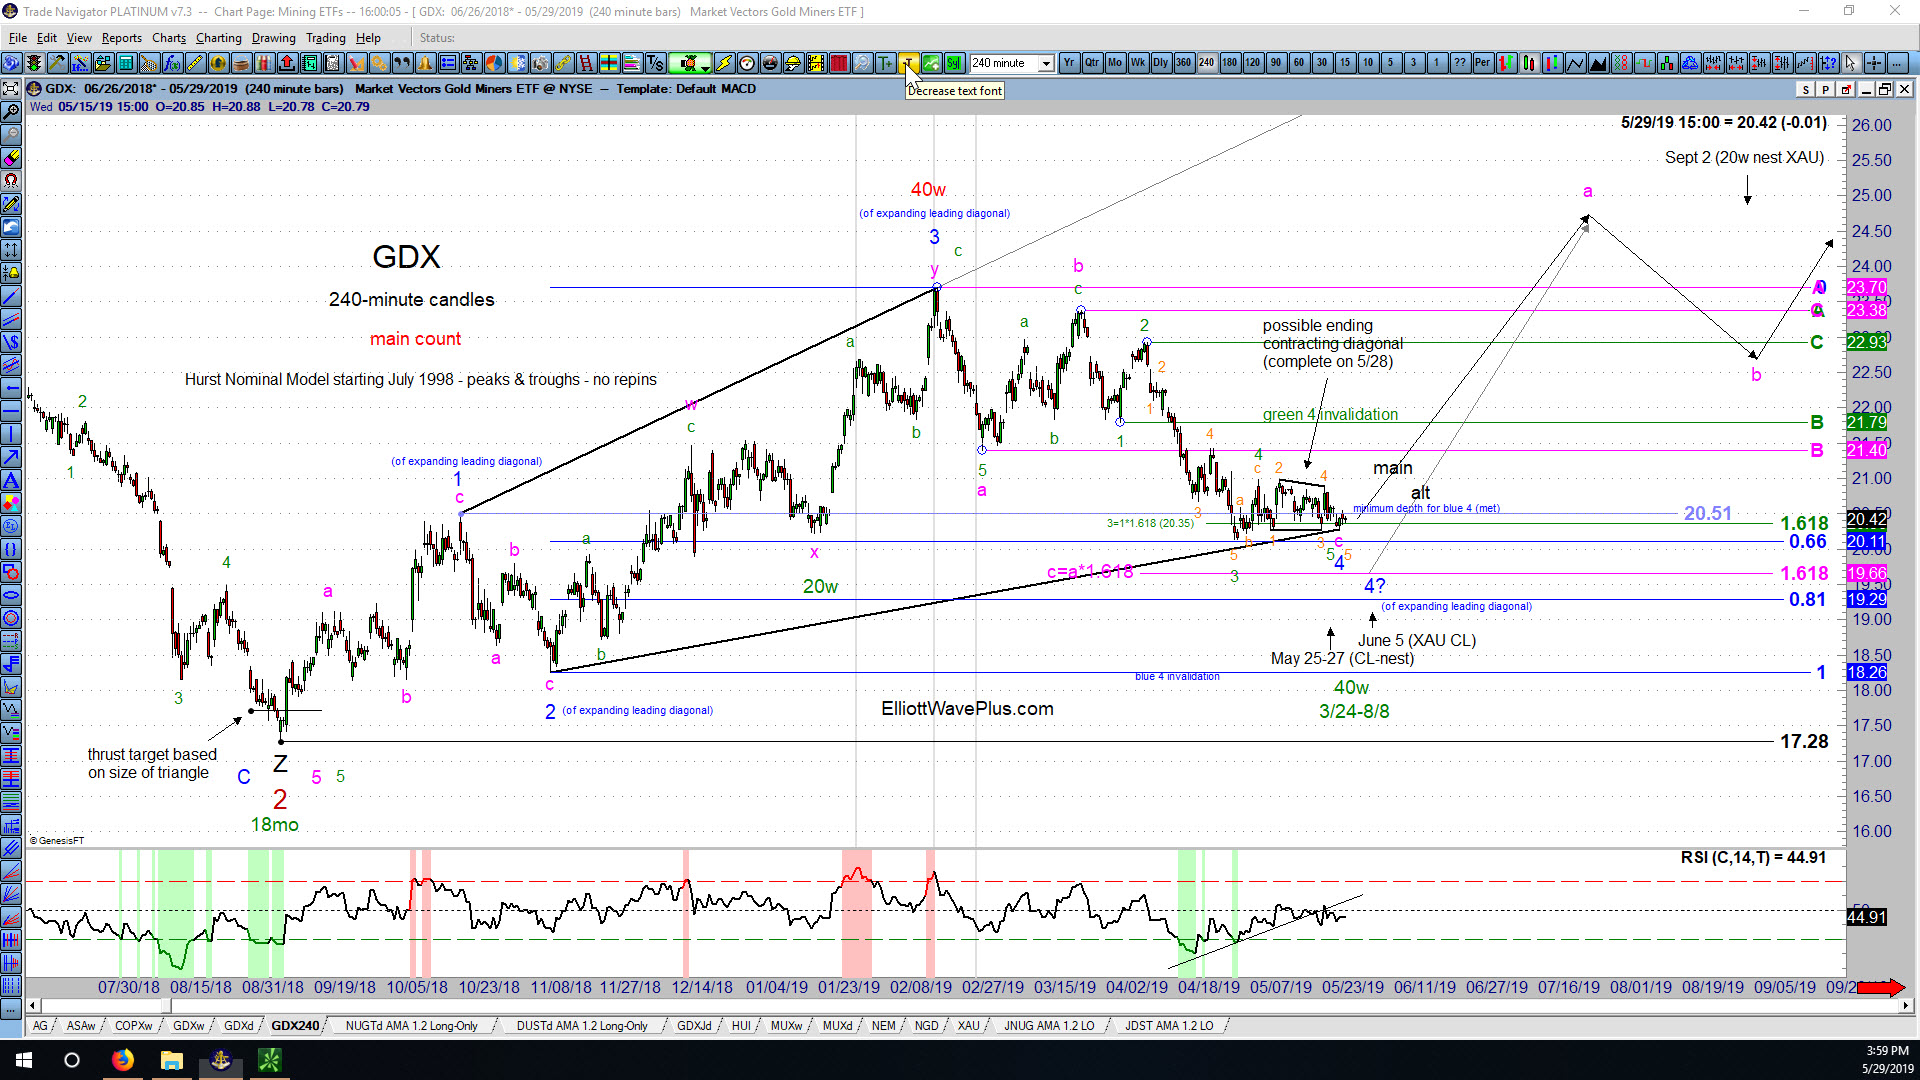
The following screenshot was provided to all Elliott Wave Plus paying subscribers on Wednesday night, May 29, 2019:
A Chartist’s View of New Gold Inc. (ticker NGD)

New Gold Incorporated is a mid-tier gold mining company with mining operations in Canada, the U.S. and Mexico. NGD stock made its all-time low of 74 cents per share in December 2008, and its all-time high of $14.15 per share in September 2011. New Gold is one of the holdings in the two most popular gold mining ETF’s, GDX and GDXJ. Its annual revenue is currently about $725 million. Let’s examine a chart of NGD starting at the 2011 high from a technical point of view.
Sid’s Highly Accurate Call on GDX during the April 4, 2017 Weekly “Counts” Webinar

Each week, Sid Norris of ElliottWavePlus.com holds a Sunday webinar for “Pro Plan” subscribers. During the session, he presents his Elliott Wave counts and associated Fibonacci price targets for many of the world’s major stock markets, commodities, currencies, and bonds. Hurst cycle analysis and retail trader sentiment are also strongly considered. Screenshots of all the […]
Video Highlight from Sid’s May 29, 2016 “Counts” Webinar – featuring GDX
The following is a two-minute video clip highlight from my May 29, 2016 “Counts” Webinar. This clip features coverage of GDX. Please join me for my Weekly “Counts” Webinar, where I go over all of my Elliott Wave counts and associated Fibonacci price targets for many of the world’s major stocks markets, commodities, currencies, and […]
Elliott Wave Update on Gold and Gold Miners (GDX) from Sid at ElliottWavePredictions.com
Elliott Wave Update on Gold and Gold Miners (GDX) from Sid at ElliottWavePredictions.com. Click on the charts to enlarge. GDX moved to slight new lows today, but the larger picture is unchanged. A large 18-month cycle trough is imminent in gold miners, and Gold and Silver appear to have already shown five small-degree waves up […]
Highlights from Sid’s Weekly “Counts” Webinar (August 9, 2015)
The video clip below contains highlights from my Weekly “Counts” webinar from three days ago (August 9, 2015). Included are portions of my analysis of the Dow Jones Industrial average, GDX, and the US Dollar Index. ALL of the calls in this video were contrarian against the so-called “consensus trades”, like long dollar, and short […]
Updated Elliott Wave Analysis of ASA by Sid from ElliottWavePredictions.com
Updated Elliott Wave Analysis of ASA by Sid from ElliottWavePredictions.com. Click on the charts to enlarge. Back on July 2nd, I posted a workup on ASA Gold and Precious Metals Limited. Since then, ASA has continued lower, and yesterday reached a significant Fibonacci target of $8.94, where wave 5 blue equaled the net traveled by […]