Have We Reached An Unsustainable Situation?

Gold & Bonds are typically correlated. As of this writing, that historic relationship appears to be intact. Compare that to Gold & the U.S dollar. Those two items typically move opposite (inverse) of each other. However, since mid-July 2019, they have generally been moving up and down together.
Bonds, which are the most popular alternative to stock ownership in the investment world, typically move opposite of the stock market. However, ever since the start of the new year (2020), stocks, bonds, gold and the US Dollar have all been rallying together. Is this a distortion that has developed because of mid-October 2019 Fed announcement of QE? Many think so. If so however, there was a delayed reaction of 2.5 months.
When the Stock Market Goes Down, Gold Goes Up. Right?

During the Jan 19 webinar, Sid showed an intermediate-term chart of Gold and the S&P-500 Index, one overlaid upon the other. The chart clearly showed that gold and the stock market don’t always move inversely, as many seem to believe. Sometimes the two items move opposite each other, but other times they generally move together, in positive correlation. For instance, since early October 2019, the two items have generally been moving to the upside together.
This video clip, taken from that January 19 weekly “Counts” webinar includes Sid’s discussion of the above myth, as well as his chart of Gold vs. the S&P. For those who believe that Gold will “save them” when the stock market crashes next, the video is worthy of consideration.
Are there potential trading profits to be made on both the upside and downside of the S&P as well as Gold? Absolutely. But the two items really should be analyzed and traded independently.
Bonus screenshot from the January 26 weekly webinar. Notice how highly correlated the S&P and the XAU (Gold & Silver Sector Index) have been since early October.
The Chinese Yuan vs Gold. How Correlated Are They?
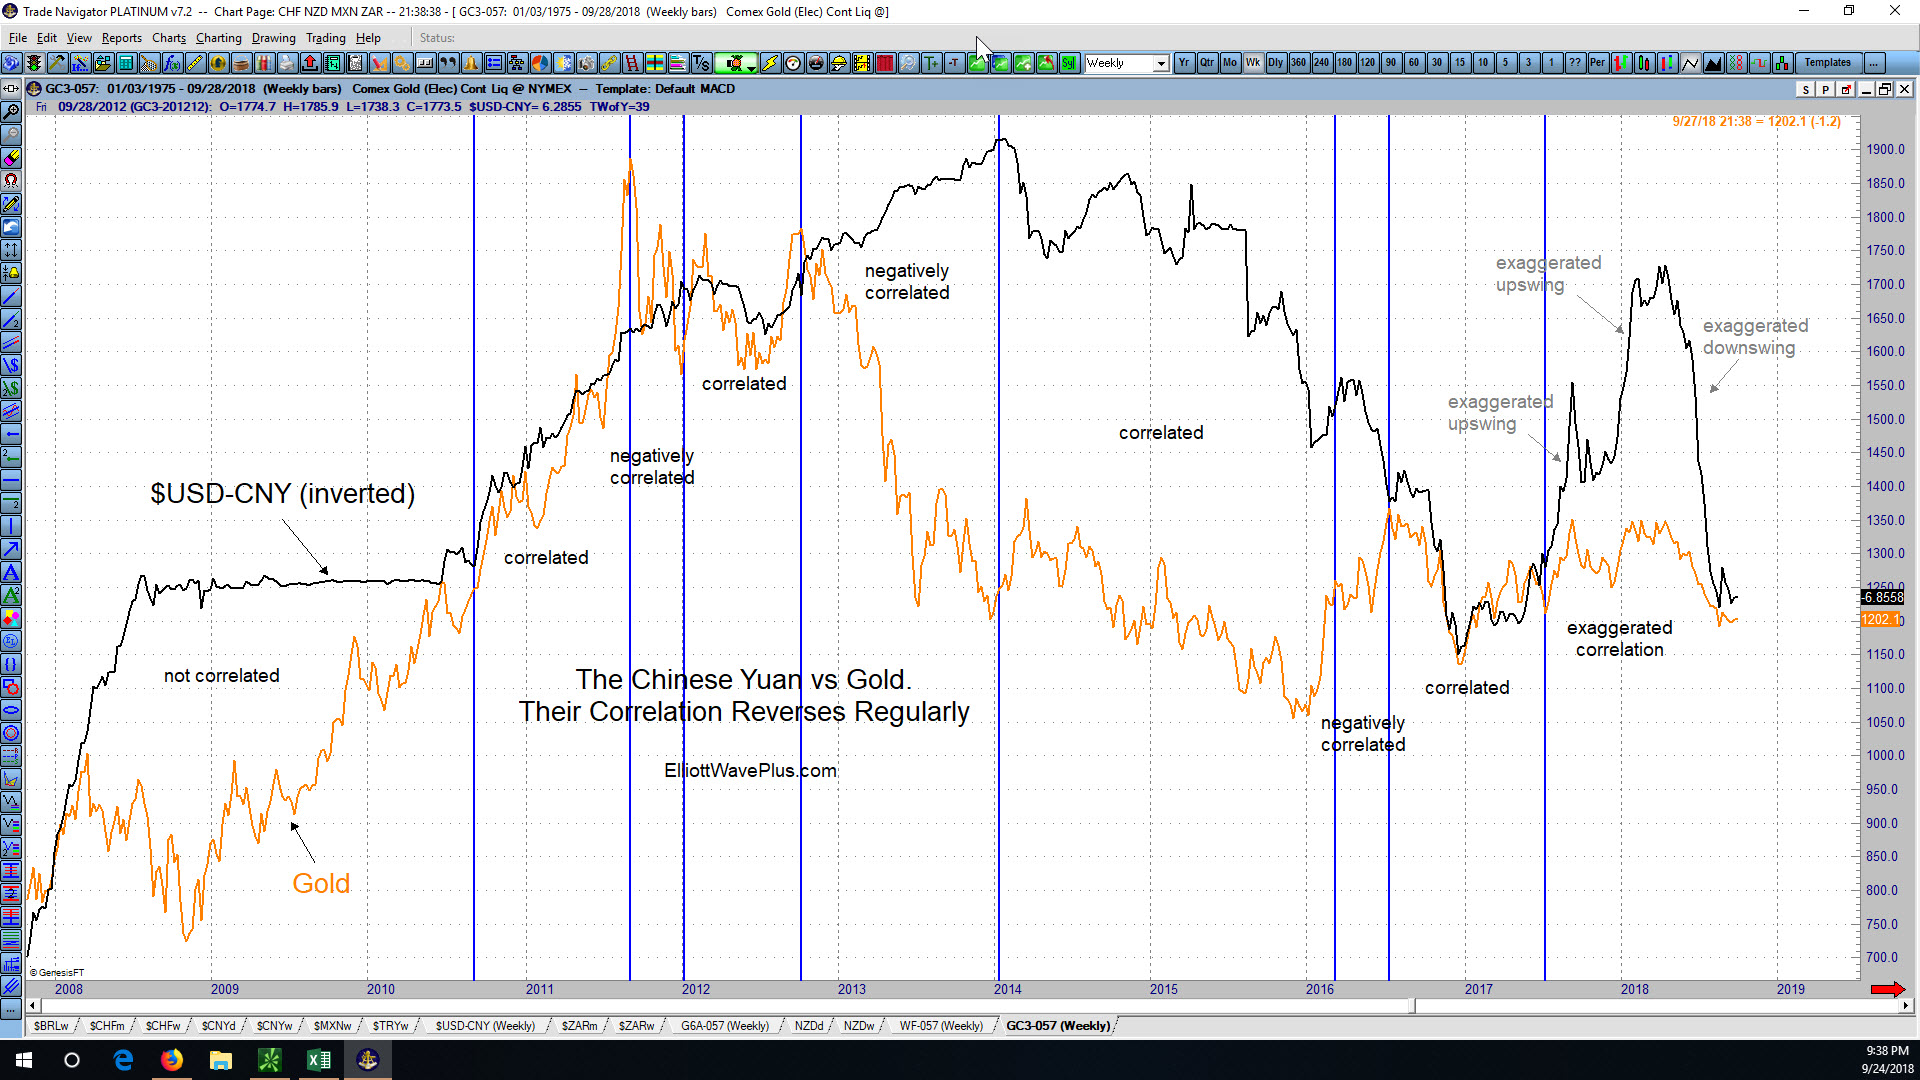
I’ve seen a number of articles lately from various sources stating that essentially the Chinese government is now in full control of the price of Gold. Admittedly, from mid-June through mid-August of this year, the price of gold moved . .
Is Gold’s Historical Correlation with the Australian Dollar and Swiss Franc Predictive?
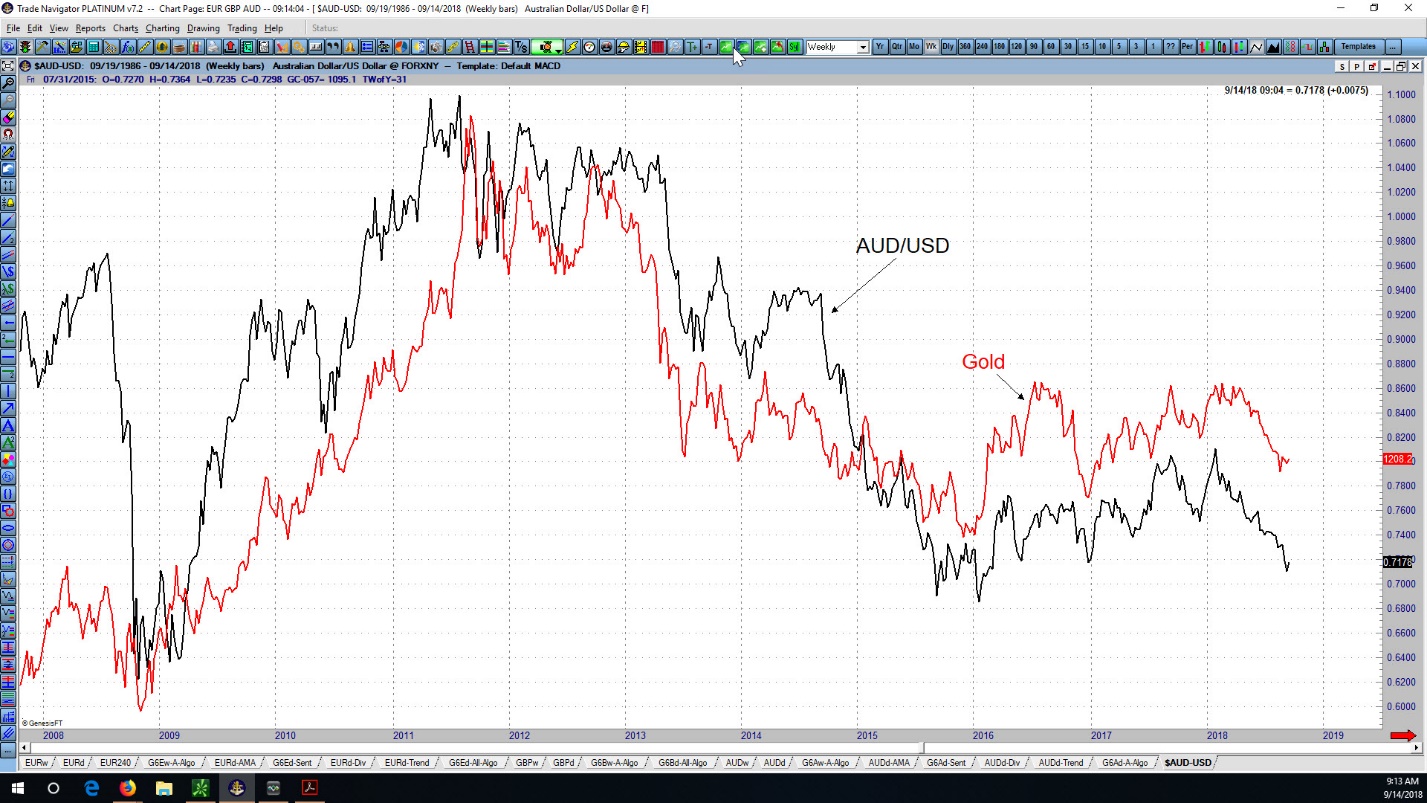
Is Gold’s Historical Correlation with the Australian Dollar and Swiss Franc Predictive? Historical Price movement in Gold is quite similar to price action in the Australian Dollar, especially since late-2008. Gold is also highly correlated with the Swiss Franc, especially since mid-2013. Recently, notice that during Gold’s April-August plunge, the Swiss Franc moved sideways. Then, in mid-August, the Swiss Franc stopped basing and started moving strongly to the upside. Gold has also moved upward since mid-August, although it has lagged the Swiss Franc in aggressiveness. Now let’s look at the AUD/USD currency pair from an Elliott Wave and Hurst Cycles perspective, first on a weekly chart.