The Dow Jones Industrial Average is Up Over 1000 Points Since Monday. Did Anyone Predict This Ahead of Time?

As far as I can tell, there were precious few market prognosticators calling for an imminent rally in the stock market just prior to this week’s surge. On the contrary, virtually all article writers and market technicians were projecting the market to move lower. As it turned out, the DJIA was up over 500 points on Tuesday, and is currently up over 1000 points for the week, and it’s only Thursday (June 6). Here’s highlights of my coverage of the DJIA and the VIX from my Sunday, June 2 Weekly “Counts” Webinar:
Trading Bitcoin with Precision Timing! (My calls on Bitcoin since late 2017)
In late 2017, the relentless parabolic move to upside in Bitcoin had caught the attention of the entire trading world. Since that time though, market participants have made OR lost a fortune during the one-year-long 84% crash of Bitcoin, depending on whether they were on the right side of the trade or not. The video below shows my analysis and projections for price movement in Bitcoin since late 2017.
There’s an FOMC meeting and announcement next week. What’s the likely market reaction in silver?

My work as a market technician is generally based on the premise that markets move based on technical aspects derived from prior price action. However, very large players with an agenda (ie: central banks around the globe) are actively involved in the markets. Can looking at both the technical and the influence of the FED provide greater insight into market forecasts? Let’s take a look.
10-Year Treasury Yields Have “Broken Out” to a New Multi-Year High. Will Yields Continue Higher?
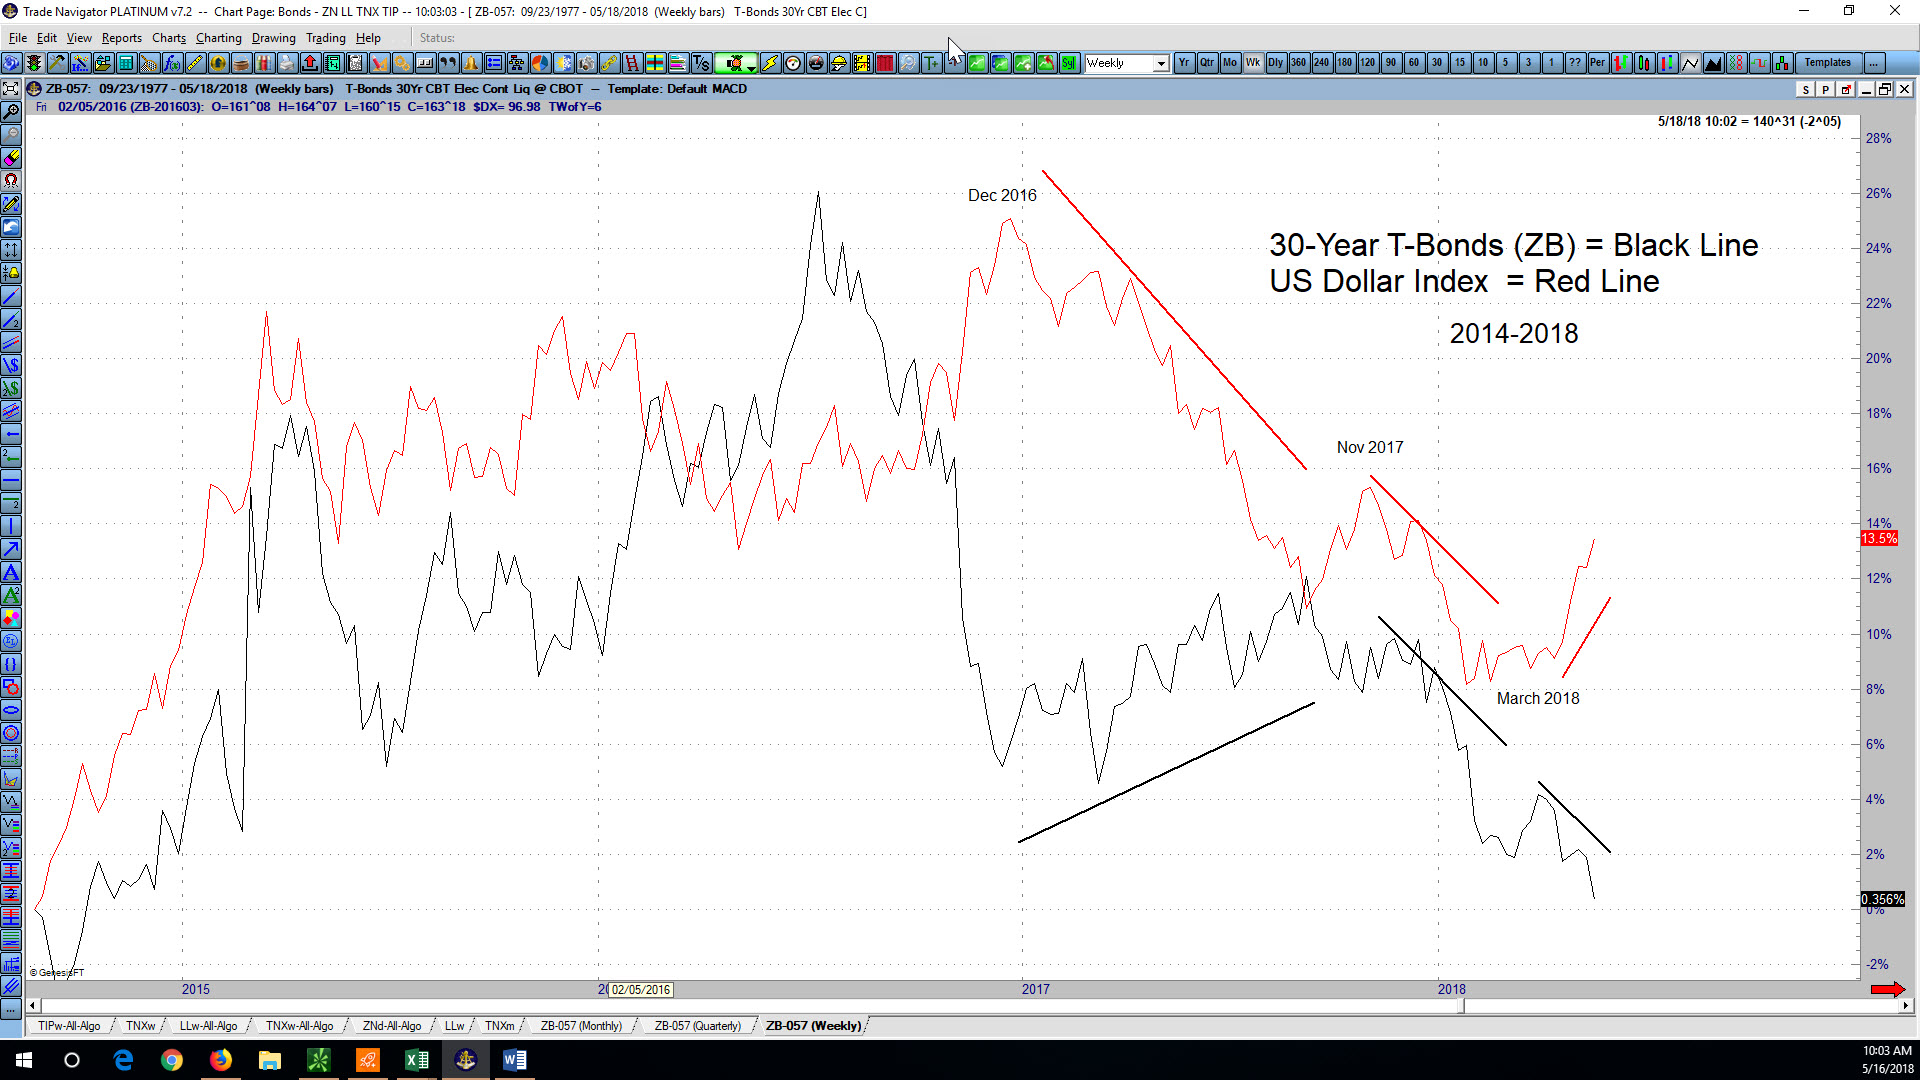
Yesterday’s market jolt, according to the talking heads on financial propaganda TV was due to 10-year treasury yields “breaking out” above their Dec 2013 high. I’m sure this slight new high invalidated a few Elliott Wave counts, and “confirmed” a few others.
How I Eliminated Emotion and Directional Bias from my Elliott Wave Counts – A blog post by Sid Norris of ElliottWavePlus.com
I’ve been labeling charts using Elliott Wave theory for a very long time. I’ve also always tracked the Elliott Wave interpretations (wave counts) from several published wave counters over the years. Almost everyone familiar with Elliott Wave theory knows that . .
Sid’s timely call on Natural Gas during the May 14, 2017 weekly “Counts” Webinar

Sid’s Timely Call on Natural Gas (NG Futures Contract) During his May 14, 2017 Weekly “Counts” Webinar. Each week, Sid Norris of ElliottWavePlus.com holds a Sunday webinar for “Pro Plan” subscribers. During the session, he presents his Elliott Wave counts and associated Fibonacci price targets for many of the world’s major stock markets, commodities, currencies, […]
Sid’s new website, ElliottWavePlus.com is the only way to subscribe to his weekly “Counts” webinars and twice-per-week EWP Screenshots starting April 10, 2017
Important Notice: Sid’s new website, ElliottWavePlus.com is the only way to subscribe to his Weekly “Counts” Webinars and twice-per-week EWP Screenshots (starting April 10, 2017). ElliottWavePlus.com is a huge improvement over ElliottWavePredictions.com! All paid subscribers can now log in to the subscriber area, where one full month of Webinar and ScreenShots history is available all […]
Announcing Sid’s New Website & Associated Client Services: ElliottWavePlus.com!
Announcing Sid’s New Website & Associated Client Services: ElliottWavePlus.com! Whew! What a ride so far! Back in 2010, I started a Google sites blog called SidsCharts.com, and used it as a simple diary of Elliott Wave counts on miscellaneous financial instruments. In 2011, I switched to a WordPress-based blog named ElliottWavePredictions.com, and initiated weekly “Counts” […]