Educational Course: Fibonacci Price Targets

Our friends at Elliott Wave International have allowed us to share some excellent education content with our subscribers! We are happy to share one of their most popular courses, for free. The 4-hour course teaches traders how to use Fibonacci levels to trade with more confidence. We use Fibonacci price targets extensively in our analysis to form our Elliott Wave counts, and we think you should, too.
The Fibonacci sequence provides the mathematical basis of the Elliott Wave Principle. The stock market’s price pattern builds fractally into similar patterns of increasing size. Familiarity with these patterns can prove incredibly useful to investors.
In the course, you’ll learn this and more:
How the Golden Ratio can help you see trading opportunities.
What the most important Fibonacci relationships are.
How Fibonacci relationships can help add confidence to your wave count.
How to project valuable time and price targets using Fibonacci dividers.
A Beginner’s Guide to Wave Counting | Educational Video

The following educational presentation was recorded live during a Synergy Traders / TimingResearch.com event held on August 4, 2020. In the one-hour video, Sid Norris of ElliottWavePlus.com focuses on multiple time-frame Dow Jones Industrial Average charts, and shows beginners/intermediates how to develop an Elliott wave count, while using Fibonacci relationships between waves to assist in labeling.
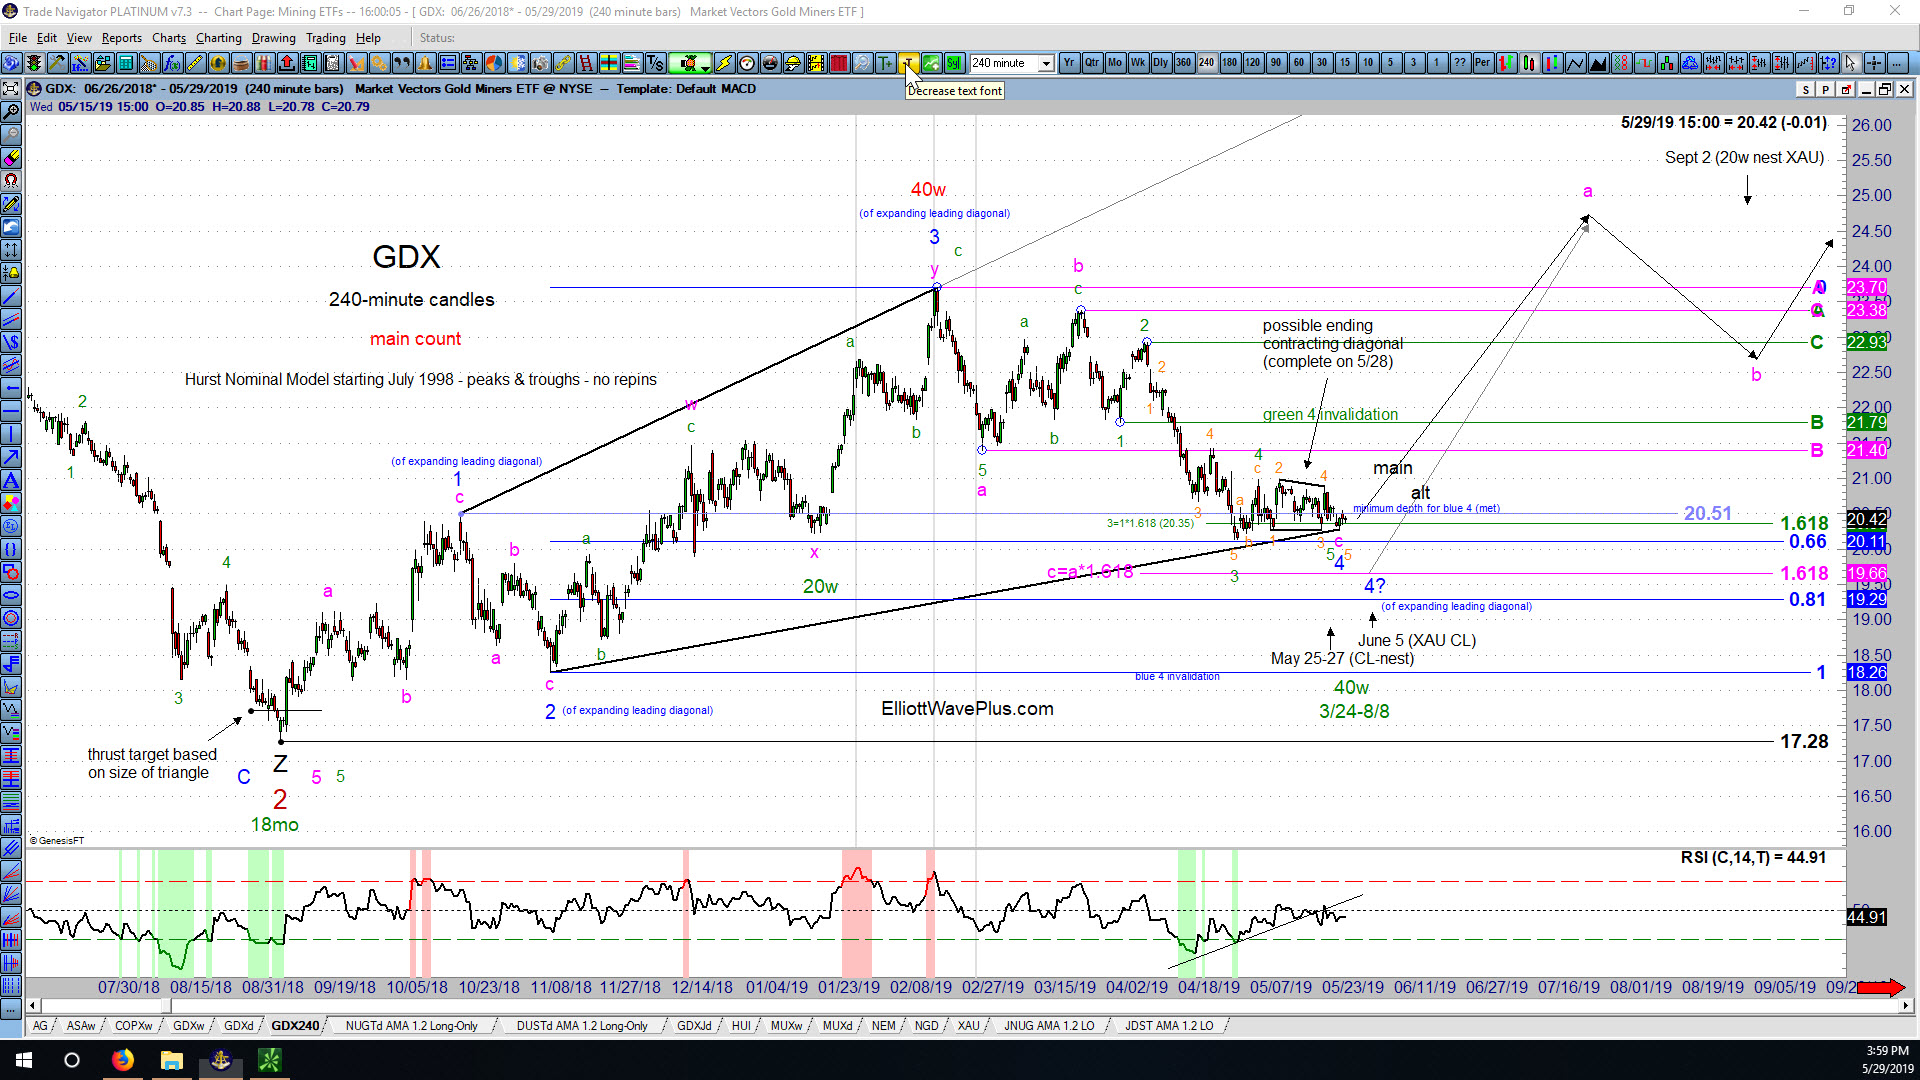
Sid’s Recent Call on GDX (Gold Miners ETF)

The following screenshot was provided to all Elliott Wave Plus paying subscribers on Wednesday night, May 29, 2019:
Combining Elliott Wave, Fibonacci and Hurst Cycle Analysis to Predict the Future Direction of the Dow Jones Industrial Average

The following charts include my main and alternate wave counts and associated Fibonacci price targets for the Dow Jones Industrial Average, starting with the quarterly, then monthly, weekly and daily charts. Hurst cycle analysis is also utilized at all time frames.
Elliott Wave Analysis of IBB (Biotech Sector ETF) by Sid from ElliottWavePredictions.com
Elliott Wave Analysis of IBB (Biotech Sector ETF) by Sid from ElliottWavePredictions.com. Click on the charts to enlarge. A quick glance at a weekly chart of IBB (above) shows the obvious parabolic rise into the July 2015 top. Parabolic bubbles are followed by crashes, so is the crash in the Biotech sector already finished, as […]
Elliott Wave, Hurst Cycles and Fibonacci Analysis of the Dow Jones Industrial Average (DJIA) by Sid from ElliottWavePredictions.com
Elliott Wave, Hurst Cycles and Fibonacci Analysis of the Dow Jones Industrial Average (DJIA) by Sid from ElliottWavePredictions.com. Click on each chart to enlarge. The Dow Jones Industrial Average is down only 2.33% since the Friday September 19 all-time high, but Hurst cycle analysis is already suggesting that a major top is “in”. As I […]
Elliott Wave Analysis of the S&P-500 (SPX) by Sid from ElliottWavePredictions.com
Elliott Wave Analysis of the S&P-500 (SPX) by Sid from ElliottWavePredictions.com. Click on the chart twice to enlarge. The most interesting aspect of the wave count shown above is that price action since the January 5 low counts as a perfect ending expanding diagonal, including a wave 5 that bounces precisely off of a line […]
Elliott Wave Analysis of the GBP/USD Currency Pair by Sid from ElliottWavePredictions.com
Elliott Wave Analysis of the GBP/USD Currency Pair by Sid from ElliottWavePredictions.com. Click on the chart twice to enlarge. My main long term wave count for the British Pound is that a triangle lasting almost 3 years ended on October 31, and a thrust projected to move almost 4000 pips downward over the next year […]
Elliott Wave Analysis of the GBP/USD Currency Pair by Sid from ElliottWavePredictions.com
Elliott Wave Analysis of the GBP/USD Currency Pair by Sid from ElliottWavePredictions.com. Click on the chart twice to enlarge. I wouldn’t be surprised if we get a rally from here in Cable, lasting possibly through tommorrow, to complete the correction of yesterday’s huge downward impulse. If that occurs, it would likely be mimicked in the […]
Elliott Wave Analysis of the S&P-500 (SPX) by Sid from ElliottWavePredictions.com
Elliott Wave Analysis of the S&P-500 (SPX) by Sid from ElliottWavePredictions.com. Click on the chart twice to enlarge. The upward movement from the November 1 low can be interpreted as a triple zigzag, and reversed right at the .786 fibonacci. The aggressiveness of the downward movement over the last 7 hours brings back the likelihood […]


