All About our Improved Nightly “Sentiment Conditions” Screenshots – from Elliott Wave Plus

It’s time for the Elliott Wave Plus Quarterly Premium Plan Webinar! Our Premium Plan is best known for supplying automated trade signals on about twenty different trade-able instruments to subscribers on a nightly basis. However, our longtime Premium Plan subscribers are telling us that our new, improved nightly “Sentiment Conditions” screenshots are easily worth the price of the subscription alone. See for yourself! We’ll spend most of the time in this online seminar revealing all aspects of our new improved Sentiment Conditions nightly screenshots. We’ll show how they can help subscribers become better informed about Commercials vs. Retail sentiment positioning, and how that knowledge can be extremely valuable when making trading decisions. Time will be allotted for Q&A.
The Chinese Yuan vs Gold. How Correlated Are They?
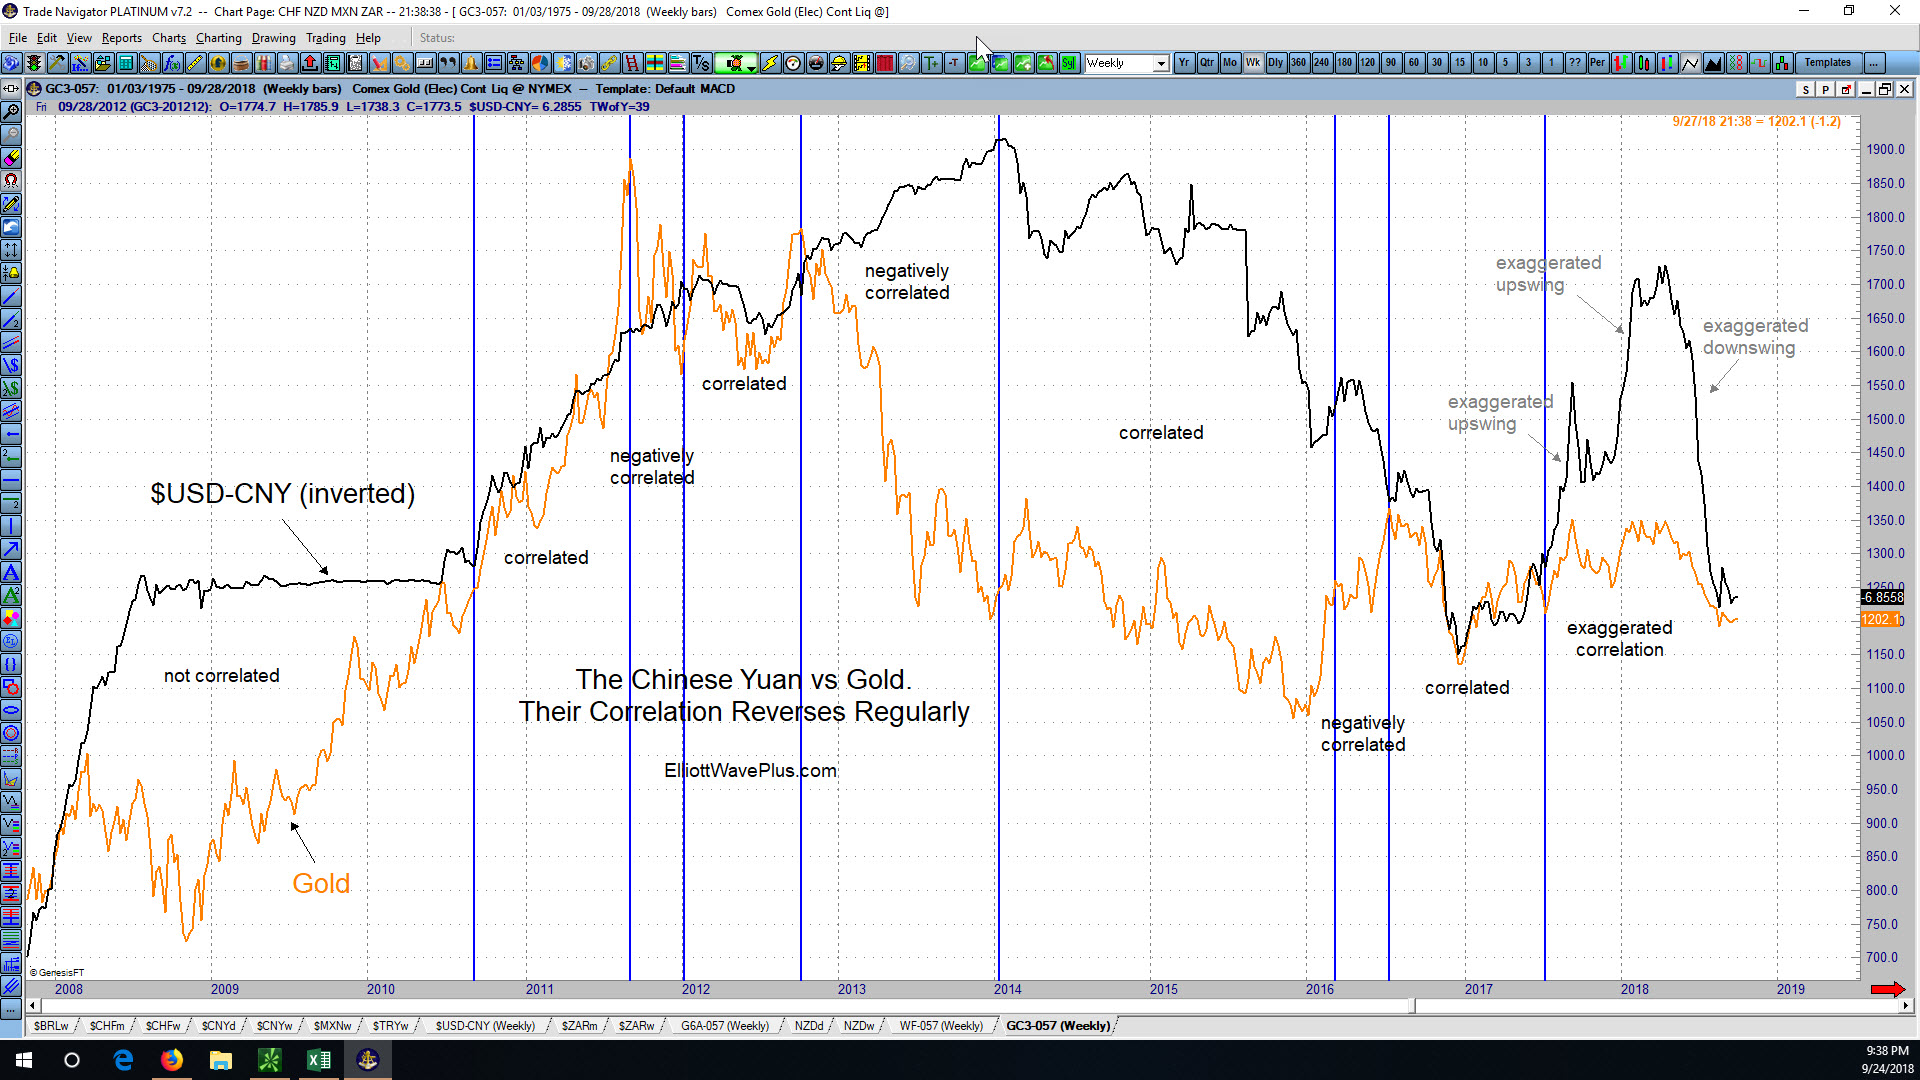
I’ve seen a number of articles lately from various sources stating that essentially the Chinese government is now in full control of the price of Gold. Admittedly, from mid-June through mid-August of this year, the price of gold moved . .
Is Gold’s Historical Correlation with the Australian Dollar and Swiss Franc Predictive?
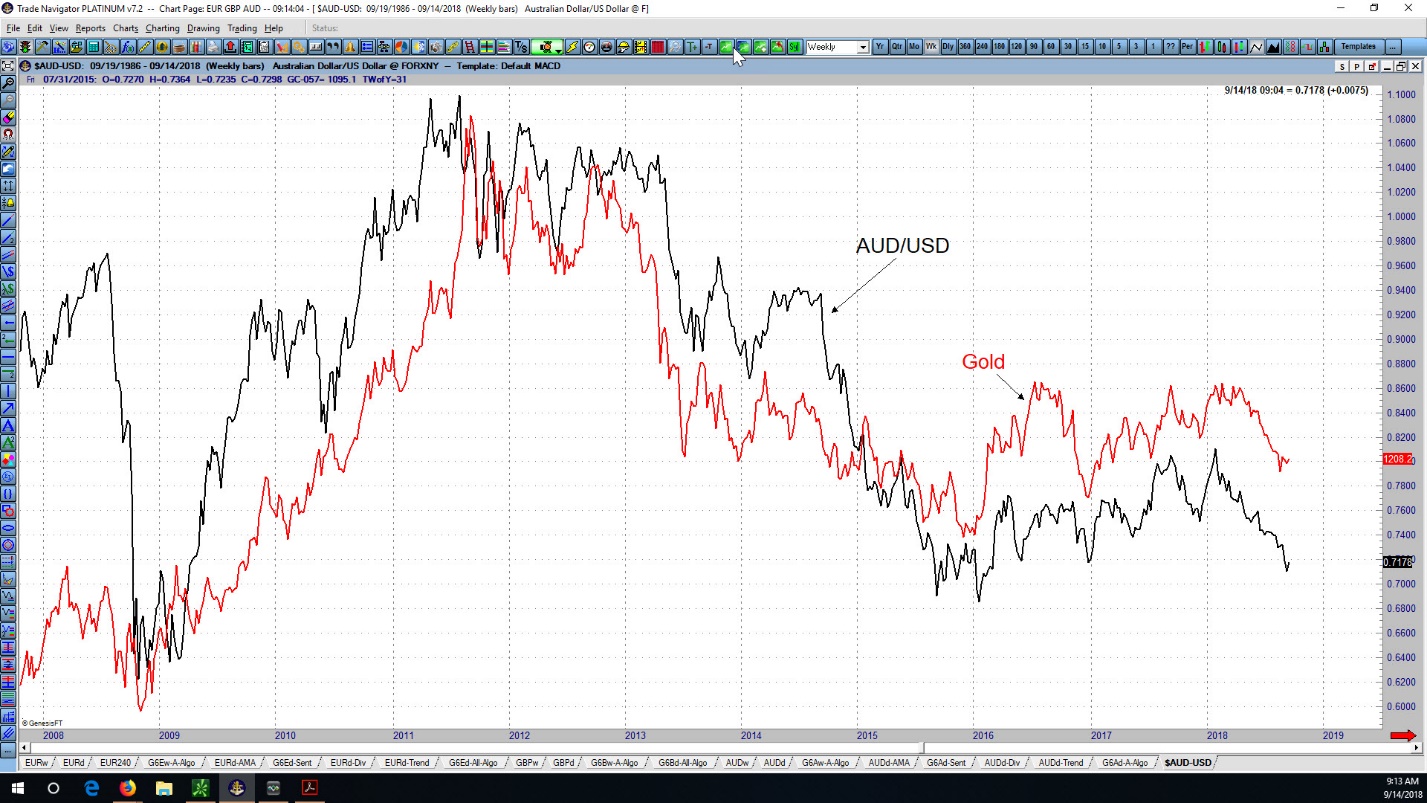
Is Gold’s Historical Correlation with the Australian Dollar and Swiss Franc Predictive? Historical Price movement in Gold is quite similar to price action in the Australian Dollar, especially since late-2008. Gold is also highly correlated with the Swiss Franc, especially since mid-2013. Recently, notice that during Gold’s April-August plunge, the Swiss Franc moved sideways. Then, in mid-August, the Swiss Franc stopped basing and started moving strongly to the upside. Gold has also moved upward since mid-August, although it has lagged the Swiss Franc in aggressiveness. Now let’s look at the AUD/USD currency pair from an Elliott Wave and Hurst Cycles perspective, first on a weekly chart.
A Chartist’s View of New Gold Inc. (ticker NGD)

New Gold Incorporated is a mid-tier gold mining company with mining operations in Canada, the U.S. and Mexico. NGD stock made its all-time low of 74 cents per share in December 2008, and its all-time high of $14.15 per share in September 2011. New Gold is one of the holdings in the two most popular gold mining ETF’s, GDX and GDXJ. Its annual revenue is currently about $725 million. Let’s examine a chart of NGD starting at the 2011 high from a technical point of view.
The Current State of the US Stock Market, the US Dollar, and Gold. A free blog post by Sid Norris of ElliottWavePlus.com
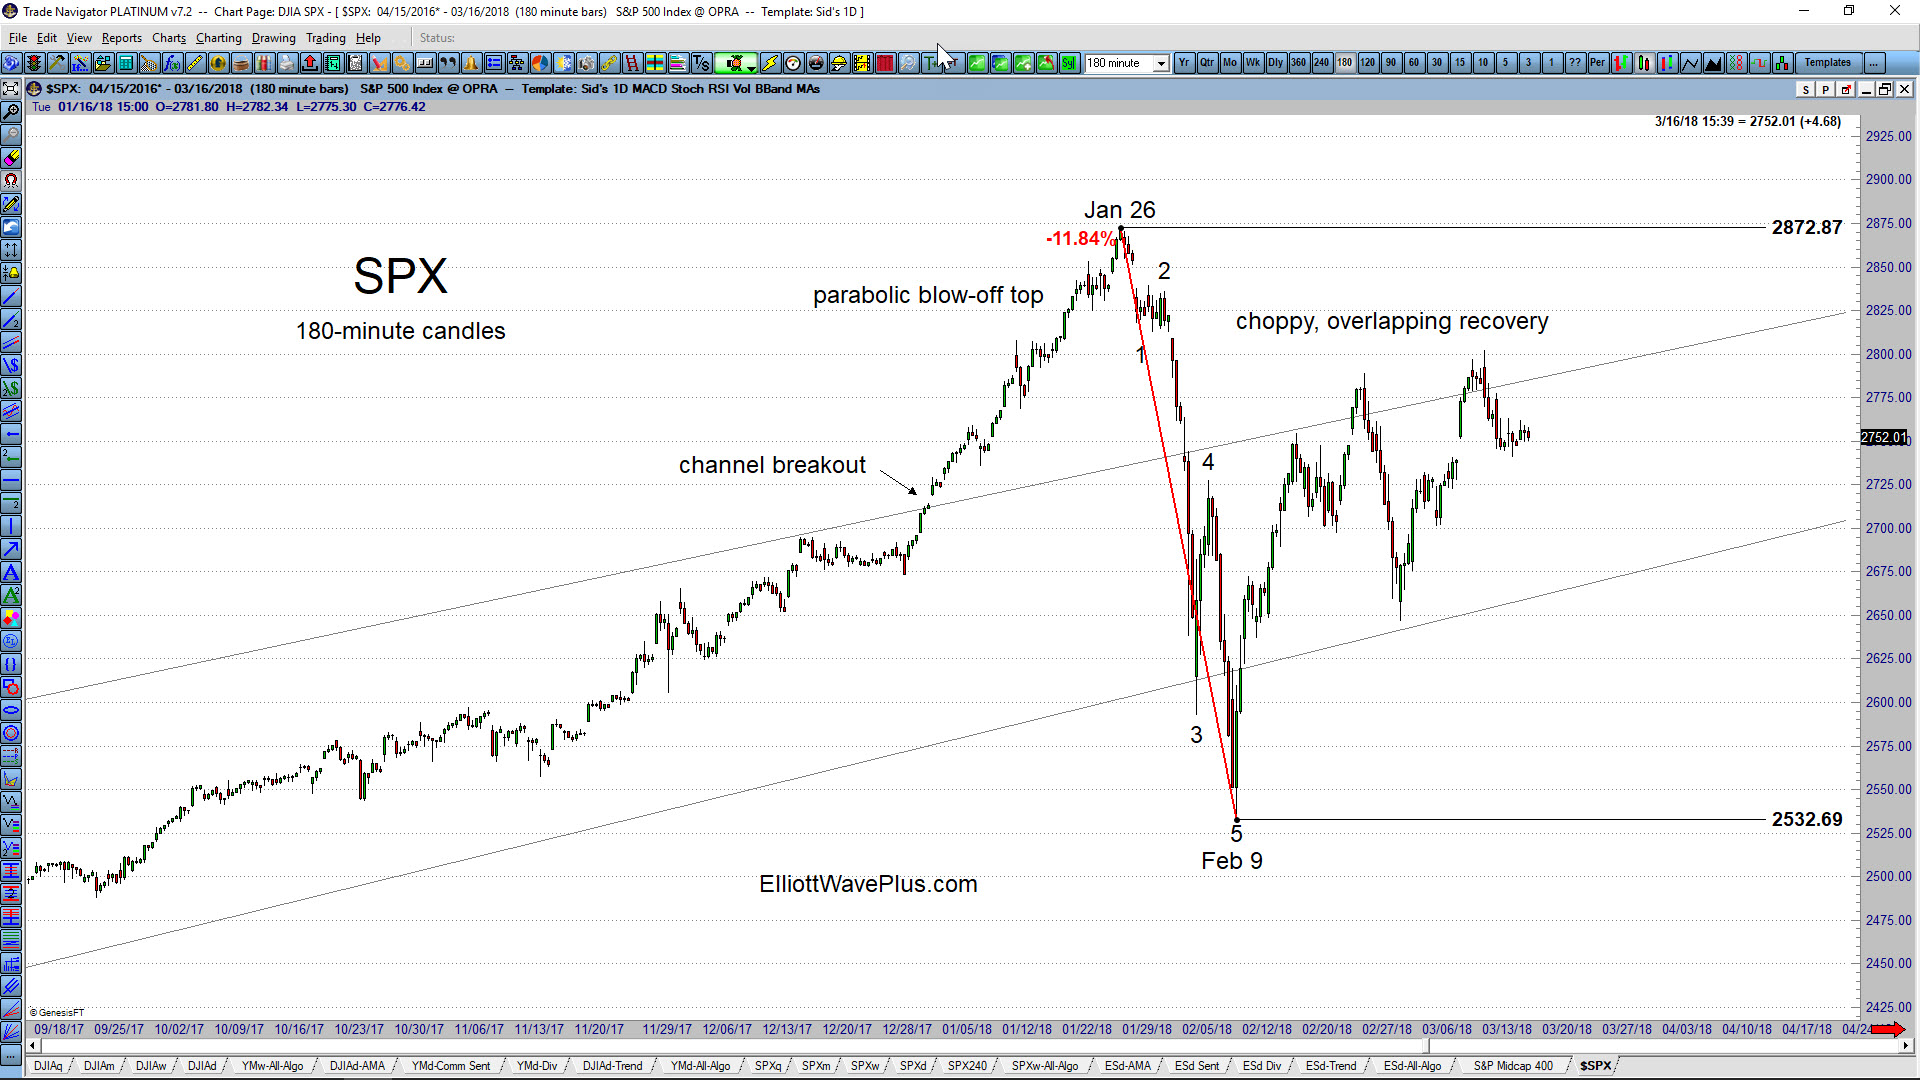
The S&P-500: The January rise in the US stock market went parabolic before topping on January 26. The 11.84% drop over the next 2 weeks (thru February 9) carved out a clear 5-wave impulse to the downside. The recovery so far appears to be choppy, overlapping, and corrective. From an Elliott Wave perspective, the aggressive move down thru Feb 9 is therefore very likely to be a wave 1 of a new downtrend, or a wave A within a 4th wave zigzag. Therefore, another 5-wave wave structure to the downside, taking out the Feb 9 low of 2532.69 would be a high probability expectation. Also possible within Elliott Wave theory is that the drop from Jan 26 thru Feb 9 was wave A within a wave 4 triangle. Only 4 of the 5 legs of a triangle are required to be a zigzag or zigzag combination. One of the legs can be something else, including a 5-wave impulse.
Gold Update (from Sid) – January 11, 2017
[vc_row][vc_column][vc_column_text title=”Gold Update”]My last ElliottWavePlus.com blog post about gold (on December 5) suggested that the deep correction in Gold was nearly finished. Gold bottomed on December 15, and has rallied nicely through today. ElliottWavePlus “Pro Plan” and Basic Plan” subscribers were made aware in the days leading into the December 15 low that Gold was […]