Trading Bitcoin with Precision Timing! (My calls on Bitcoin since late 2017)
In late 2017, the relentless parabolic move to upside in Bitcoin had caught the attention of the entire trading world. Since that time though, market participants have made OR lost a fortune during the one-year-long 84% crash of Bitcoin, depending on whether they were on the right side of the trade or not. The video below shows my analysis and projections for price movement in Bitcoin since late 2017.
Sid’s Recent Call on GDX (Gold Miners ETF)
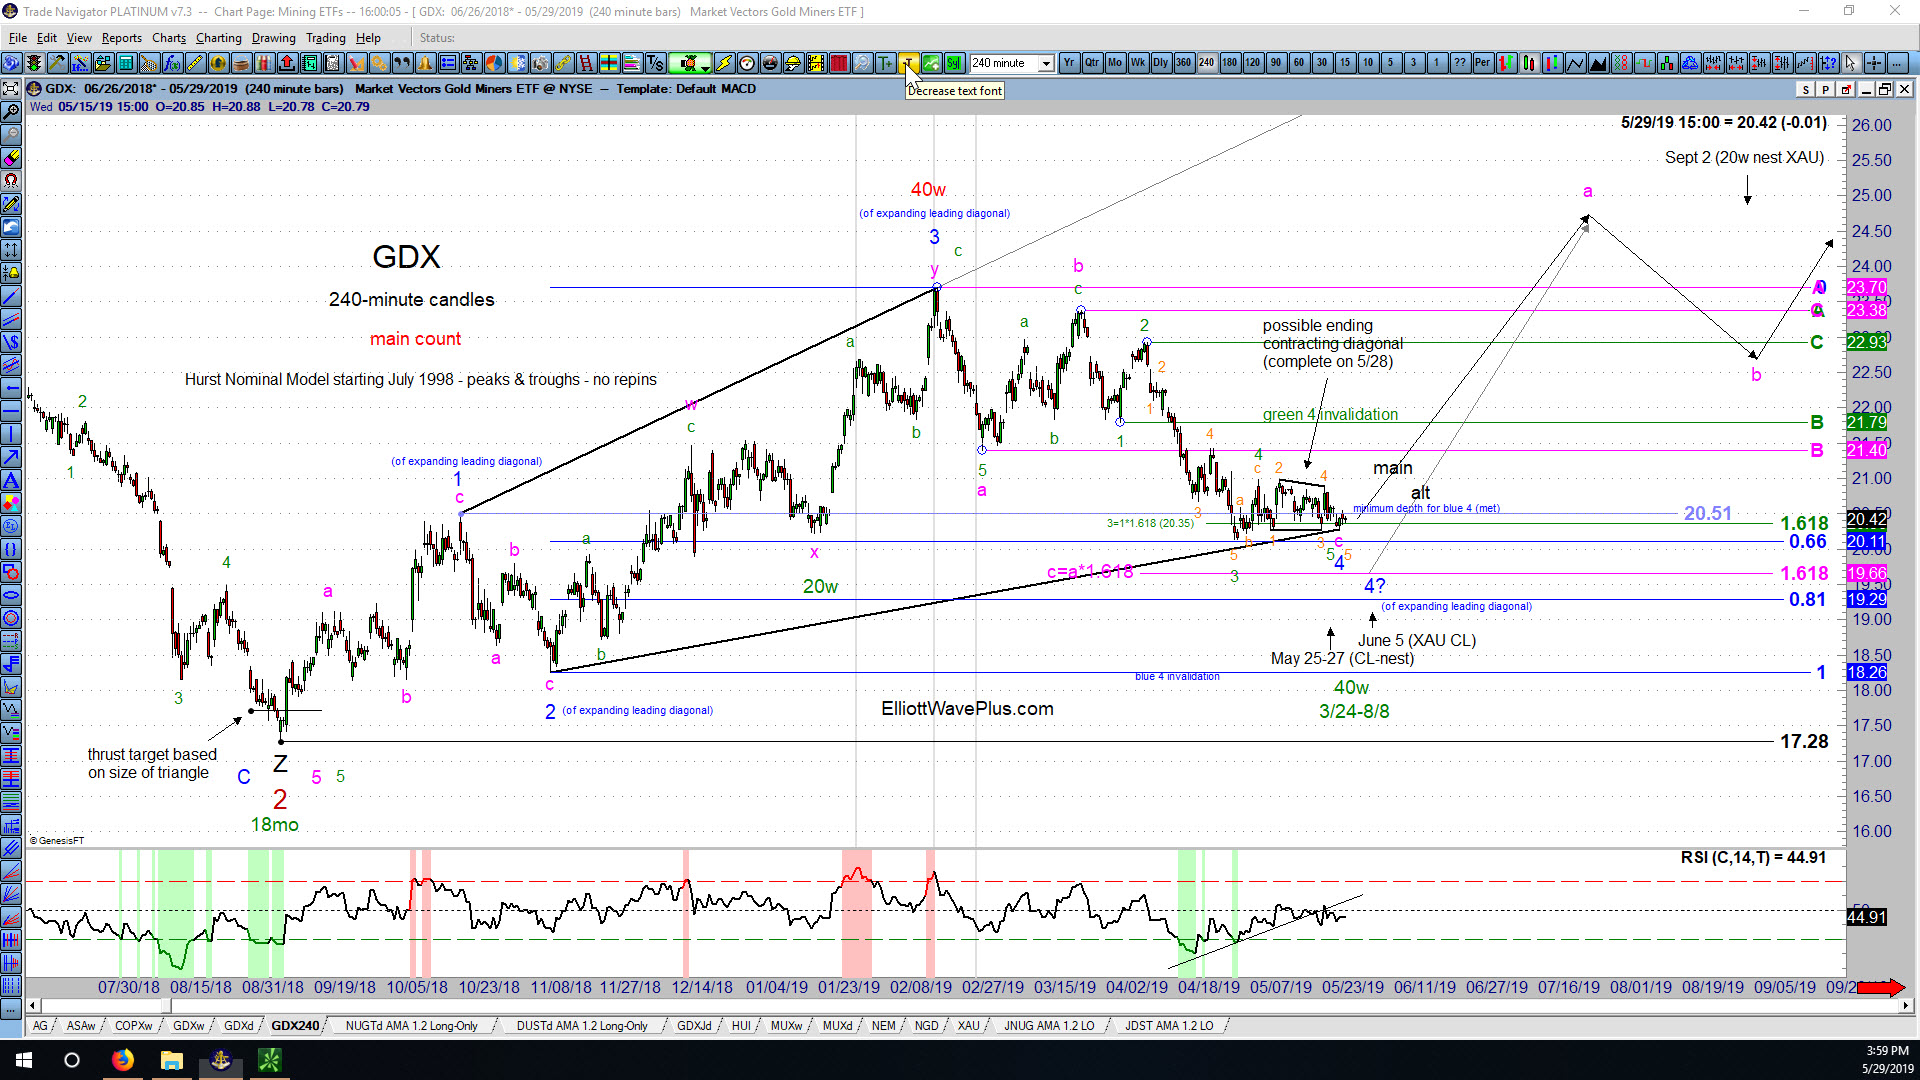
The following screenshot was provided to all Elliott Wave Plus paying subscribers on Wednesday night, May 29, 2019:
Combining Elliott Wave, Fibonacci and Hurst Cycle Analysis to Predict the Future Direction of the Dow Jones Industrial Average

The following charts include my main and alternate wave counts and associated Fibonacci price targets for the Dow Jones Industrial Average, starting with the quarterly, then monthly, weekly and daily charts. Hurst cycle analysis is also utilized at all time frames.
Technical Analysis of the CRB Index (the Commodities Complex) by Sid Norris from ElliottWavePlus.com

The weekly chart (below) of the CRB Index (cash) shows my main Elliott wave count and associated Fibonacci price targets, as well as Cycle analysis, utilizing both the Hurst system and a custom 3.5-year model. (Click on the chart to enlarge).
My Current Analysis of the S&P-500 by Sid Norris from ElliottWavePlus.com

From an Elliott Wave perspective, my top two wave counts are shown. The main count is that an incomplete expanding leading diagonal to the downside is underway starting at the September 21 all-time high. The alternate (shown with question marks) is that an intermediate degree (black) wave 5 to the upside commenced at the December 24 low.