Trading AAPL (Apple Stock) with Precision Timing!
During the June 2 weekly webinar, Sid expected an important bottom was imminent for AAPL. That bottom came in the very next day. From there, Sid predicted a push to the upside for the rest of the month. He stated in the weekly webinar that AAPL would reach a top near the end of July. The stock peaked on July 31 and continued to meticulously follow Sid’s Elliott Wave count.
Trading the DOW with Precision Timing!

In late May, Sid projected a road map for the DOW, calling for an early June bottom and a late July top. Check out this video including excerpts from Sid’s June 2 and June 9, 2019 webinars, which included amazingly accurate calls for the recent multi-week swing low and swing high in the DJIA (Dow Jones Industrial Average):
The Current State of the US Stock Market, the US Dollar, and Gold. A free blog post by Sid Norris of ElliottWavePlus.com
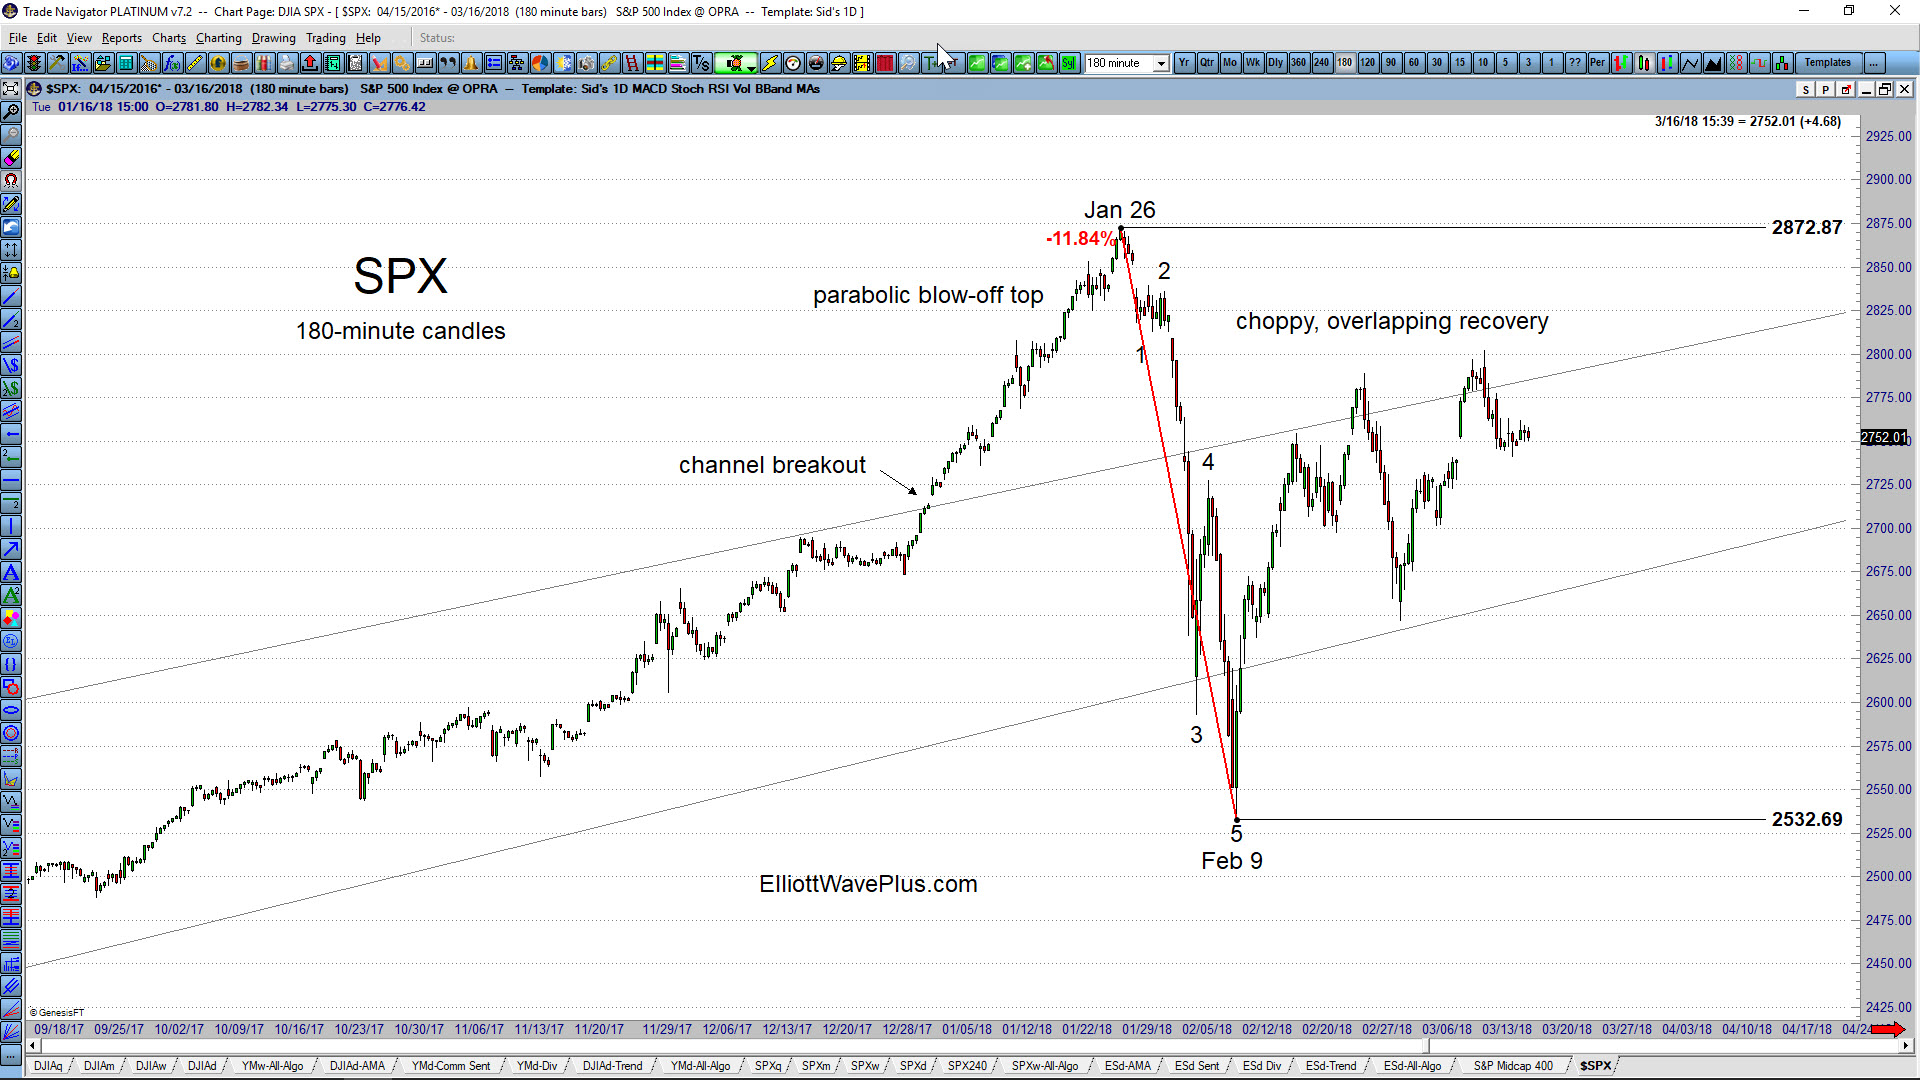
The S&P-500: The January rise in the US stock market went parabolic before topping on January 26. The 11.84% drop over the next 2 weeks (thru February 9) carved out a clear 5-wave impulse to the downside. The recovery so far appears to be choppy, overlapping, and corrective. From an Elliott Wave perspective, the aggressive move down thru Feb 9 is therefore very likely to be a wave 1 of a new downtrend, or a wave A within a 4th wave zigzag. Therefore, another 5-wave wave structure to the downside, taking out the Feb 9 low of 2532.69 would be a high probability expectation. Also possible within Elliott Wave theory is that the drop from Jan 26 thru Feb 9 was wave A within a wave 4 triangle. Only 4 of the 5 legs of a triangle are required to be a zigzag or zigzag combination. One of the legs can be something else, including a 5-wave impulse.
Thoughts on the Current State of the Stock Market (and other stuff) – A blog post by Sid Norris from ElliottWavePlus.com

Without further ado, here are the current combined Hurst projections on several items of interest:
1) US Stock Market: a major top in late 2017 is expected, to be followed by an ABC correction through the year 2024. (And no, I haven’t called the top yet like those super blogging, email blasting, google search manipulators! (-:) From an Elliott Wave perspective, the 5-wave impulse up from the March 2009 low is likely to end soon, though. That bull market will have lasted about 8.5 years, so even if the 2009-2017 bull was a very bullish cycle-degree wave 1 (my main count), a multi-year (cycle-degree) correction would be next.
Elliott Wave Analysis of the Dow Jones Industrial Average (DJIA) by Sid from ElliottWavePredictions.com
Elliott Wave Analysis of the Dow Jones Industrial Average (DJIA) by Sid from ElliottWavePredictions.com. Click on the chart twice to enlarge. As expected in my last (Jan 31) post, the S&P did manage to eventually reach the 1343.11 required minimum target to complete an expanding ending diagonal, but the Dow hasn’t quite reached its equivalent […]
Elliott Wave Analysis of the Dow Jones Industrial Average (DJIA) by Sid from ElliottWavePredictions.com
Elliott Wave Analysis of the Dow Jones Industrial Average (DJIA) by Sid from ElliottWavePredictions.com. Click on the chart twice to enlarge. As you can see on the chart, upward movement may have concluded with an exhaustion gap to open the first day of trading this year. However, if the Dow Jones Industrial Average does manage […]
Elliott Wave Analysis of the S&P-500 (SPX) by Sid from ElliottWavePredictions.com
Elliott Wave Analysis of the S&P-500 (SPX) by Sid from ElliottWavePredictions.com. Click on the chart twice to enlarge. Today’s large opening gap was followed immediately by a stall-out, and the session actually closed beneath the open. Not a good sign. This could easily have been an exhaustion gap, to be followed soon by a possible […]
Elliott Wave Analysis of the S&P-500 (SPX) by Sid from ElliottWavePredictions.com
Elliott Wave Analysis of the S&P-500 (SPX) by Sid from ElliottWavePredictions.com. Click on the chart twice to enlarge. This last push to the upside appears to be pointing to 1279 on January 3rd/4th, needing only to complete wave 5 pink to the upside, as shown. If this count is correct, the high for 2012 in […]
Elliott Wave Analysis of the S&P-500 (ES futures contract) by Sid from ElliottWavePredictions.com
Elliott Wave Analysis of the S&P-500 (ES futures contract) by Sid from ElliottWavePredictions.com. Click on the chart twice to enlarge. This more immediately bearish alternate wave count appears to be as legitimate as any any other I can conjure up at the moment. (For a larger look at my long standing main wave count for […]
Elliott Wave Analysis of the S&P-500 (SPX) by Sid from ElliottWavePredictions.com
Elliott Wave Analysis of the S&P-500 (SPX) by Sid from ElliottWavePredictions.com. Click on the chart twice to enlarge. The main idea remains the same: Because I can count 5 waves up from the November 25 low (1158.66), it is highly likely that there will be another 5-wave impulse to the upside to complete a zigzag […]