Elliott Wave Hub Event

Stock Trading with Monitors

Another bi-annual Elliott Wave Hub Event is in the books, and Sid Norris was the first presenter of the day, February 13, 2024. During his presentation, Sid offered a glimpse of what we provide subscribers inside our four different levels of service.  He also showed his current Elliott Wave counts and associated Fibonacci price targets on the Dow Jones Industrials. Transports, and Utilities, as well as the S&P-500, XLF financials, GDX gold miners, and a Hurst Cycle analysis of the US Dollar Index.   The markets are at or near a protentional turning point!  A special, limited time offer was also presented for new subscribers.

Elliott Wave Hub Presentation

Stock Trading with Monitors

During this presentation, Sid showed his current wave counts on the Dow Jones Industrial Average, the S&P-500, Bonds, and Gold. 

Why Our Trading System is Superior to Others

We avoid directional bias by utilizing a combination of dissimilar but robust technical analysis tools and have developed a mix of the specific tools most likely to provide timely trading setups.  

What’s Driving the Markets this Year? 
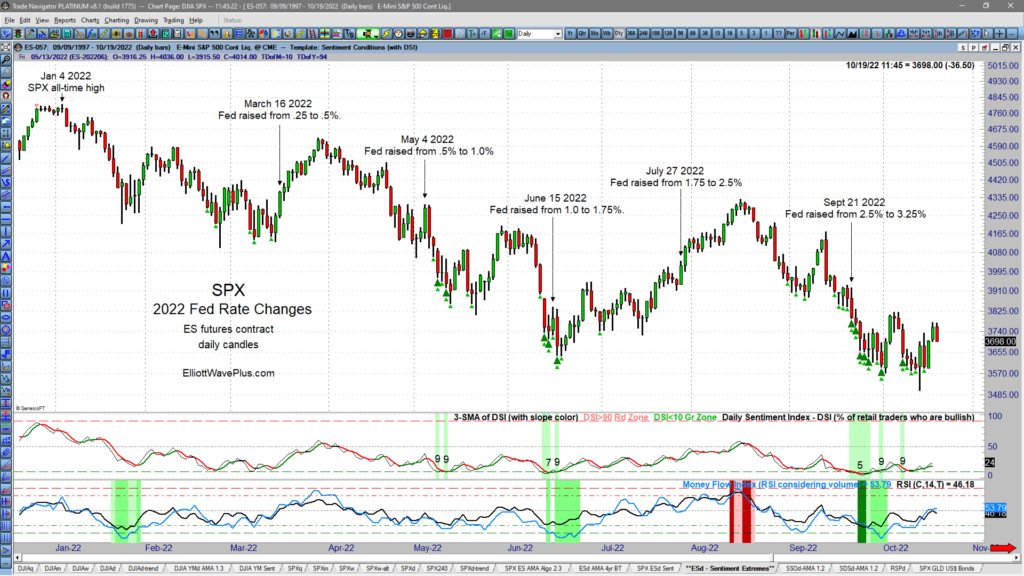
What’s been driving the markets this year? If your market research consists primarily of watching financial television channels, you’d swear that the Fed must be controlling all market movements like it was a puppet master!  The vast majority of TV pundits will answer questions about where the market is going next with at least some mention of the Fed.  Let’s look at all the Fed’s rate changes so far this year to see if they are producing consistent buy or sell signals for investors and traders.

How to Utilize Elliott Wave Plus

Welcome to the October 2022 Quarterly Premium Plan Webinar.  These quarterly events are Elliott Wave Plus’s most anticipated events. Our current subscribers find these recording extremely useful, as do our free visitors at ElliottWavePlus.com.  This video and blog will show how to best utilize our service offerings here at Elliott Wave Plus and will help new subscribers decide which subscription tier is right for them.

Quarterly Premium Plan Webinar and Sortable Spreadsheet – Aug 4, 2022

We believe our sentiment condition screenshots are so amazingly valuable to traders, we wanted to spend some time showing viewers how to read those charts, and how to utilize them in your trading. These charts show DSI (retail positioning), and multiple measures of commercials (the producers/hedgers) positioning. As we all know, retail traders are notoriously positioned on the wrong side of trade at major turns. Knowing retail vs commercial is crucial when timing your trades.

Quarterly Premium Plan Webinar – January 25, 2022

It’s the first quarter of 2022, which means you’re in luck! The quarterly premium-plan webinar is now available for everyone to watch! If you’re new to Elliott Wave Plus, this is a chance for everyone to view an in-depth webinar where Sid goes over everything our premium plan subscribers get on a nightly basis! Every 3 months, Elliott Wave Plus reoptimizes it’s proprietary algos to the most current 3-year backtest results. In this blog, you will see all of the items covered on the nightly algo report, and which items have had the best results. Spoiler alert, the S&P-500 equivalent (SPX ES) had some amazing results! There were plenty of interesting topics discussed during the live webinar, so we encourage you to watch the entire video. Also, Sid has a special promotion for anyone interested in his most recent 4+ HOUR weekly counts webinar, where he goes over all of his Elliott Wave counts and associated Fibonacci price targets, for many of the world’s major stock markets, commodities, currencies, and bonds. Hurst Cycle analysis is also considered on virtually all items.

The Premium Plan consists of:
Nightly screenshots on over 20 trading instruments (stock index futures, commodities, currencies, bonds, etc.), showing the most recent momentum buy/sell signals, change stop to trailing indicators, and/or exit trade suggestions. Please visit ElliottWavePlus.com to see the full list of items covered.
Sentiment positioning on all items that contain sentiment data.
A nightly summary report including algo signals, sentiment conditions, Sid’s Elliott wave roadmap, and Hurst Cycle analysis on twenty items.
A nightly email letting subscribers know that today’s signals are available to view and download.
You’ll also be able to download a sortable excel spreadsheet showing the most recent 3-year backtest results. This sortable chart shows everything!

Dow Jones Industrial Average | Comprehensive Technical Analysis

Dow Jones Industrial Average – Comprehensive Technical Analysis
Today’s video post is an excerpt of our January 2, 2022 weekly Counts webinar for Pro and Premium Plan subscribers at ElliottWavePlus.com.  This excerpt consists of Sid’s highly detailed coverage of the Dow Jones Industrial Average.  Sid starts by showing a cluster of several long-term Fibonacci targets in the 41-44K range on the Dow.

Sid explains that all this market needs to produce that grand Supercycle wave 3 top is a completed 5-wave structure up from the March 2020 low into that long-term target range.  At this juncture, it appears that a 5-wave non-overlapping impulse is well underway from that March 2020 low.  Hurst cycle analysis is current projecting that a major top will occur in the Dow in approximately late-May 2022.  The Hurst projected top on the highly correlated S&P-500 is a little later, in late-Sept 2022.

GDX Miners Call 2021

GDX miners coverage 2021. In mid-November of 2021, there was a flood of articles being published around the internet that were extremely bullish gold, silver and the precious metals mining stocks. We know that at the time, there were also numerous self-professed Elliott Wave gurus preferring bullish wave counts. Sid’s use of Elliott Wave and Hurst allowed him to project an accurate GDX roadmap for subscribers.The key to our GDX roadmap was the expectation of a 20-week Hurst cycle PEAK in mid-November. Just as the masses were screaming “GOLD BREAKOUT!”, we were expecting a reversal.Check out the video, which is a great example of Sid’s typical weekly “counts” webinar coverage. Keep in mind, this is coverage over one specific item. Sid goes into detailed analysis on dozens of items every single week.
XLE Call

Then, more recently, during his August 22, 2021 weekend “Counts” webinar, Sid suggested that the correction since March in XLE had likely ended, and that large-cap oil companies should rally once again for several months, this time out of a larger 18-month Hurst cycle trough.  As of today, XLE is up 31.61% from its August 19, 2021 low.

The Outcome

To put this into perspective, had subscribers bought $10,000 worth of XLE at the open on November 2 ($29.11), and closed that position upon the first appearance of a deeply overbought pink exhaustion stripe on our daily charts (at $52.20 open on March 10, 2021), that 10K would have turned into $17,932, a profit of $7,932.  Additionally, had subscribers bought $10,000 worth of XLE at the opening price of $47.00 on August 23, and held until the first pink exhaustion stripe occurred, taking profit at $57.62 on October 22, that would have turned the $10K investment into $12,260, an additional profit of $2,260.  Total profit by these two example trades?  $10,192.  Not too shabby!

Our question for you is, if you aren’t a current subscriber, why not?
The Premium Plan consists of:
Nightly screenshots on over 20 trading instruments (stock index futures, commodities, currencies, bonds, etc.), showing the most recent momentum buy/sell signals, change stop to trailing indicators, and/or exit trade suggestions. Please visit ElliottWavePlus.com to see the full list of items covered.
Sentiment positioning on all items that contain sentiment data.
A nightly summary report including algo signals, sentiment conditions, Sid’s Elliott wave roadmap, and Hurst Cycle analysis on twenty items.
A nightly email letting subscribers know that today’s signals are available to view and download.
You’ll also be able to download a sortable excel spreadsheet showing the most recent 3-year backtest results. This sortable chart shows everything!