What’s Driving the Markets this Year?
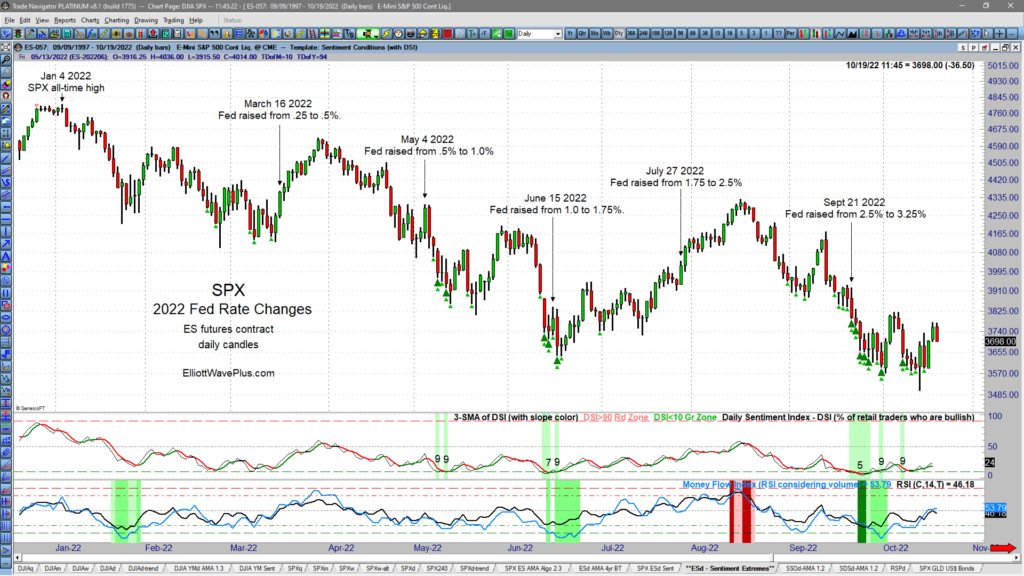
What’s been driving the markets this year? If your market research consists primarily of watching financial television channels, you’d swear that the Fed must be controlling all market movements like it was a puppet master! The vast majority of TV pundits will answer questions about where the market is going next with at least some mention of the Fed. Let’s look at all the Fed’s rate changes so far this year to see if they are producing consistent buy or sell signals for investors and traders.
Are Interest Rates Topping? Has Inflation Peaked?
The following video clip from our April 10, 2022 Weekly Counts Webinar provide timely food for thought on those two questions. Possible conclusions are based on Elliott wave theory and its associated Fibonacci price targets, multi-decades trendlines (on semilog charts), and current sentiment conditions.
Rising Interest Rates and Inflation are all over the news. Conventional expectations of the directional market reactions to news have been consistently wrong. Investors are confused and worried. It’s time to get technical.
Technical analysis eliminates the worry and confusion. It ignores mainstream financial media, and their ridiculous, news-based explanations of why the market moves up and down. Elliott Wave theory, Cycle analysis and Sentiment Conditions are more important to traders and investors now than ever before.
The attached video clip was recorded on Sunday, April 12, and was a small portion of Sid’s Weekly Counts Webinar for ElliottWavePlus.com subscribers (Pro Plan and up).
In the video, Sid Norris examines TNX (bond yields), and TIP (Treasury Inflation Protection bonds). Are rates going to continue to skyrocket unabated? Is the aggressive inflationary period over?
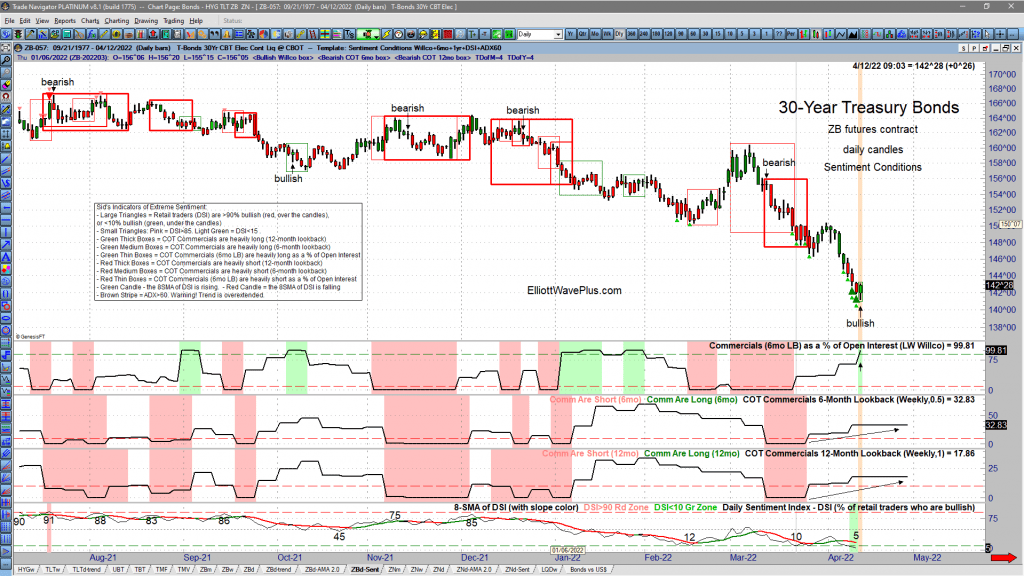
Additional evidence of Sentiment extremes in bonds were presented later in the webinar. Here are current screenshots of current Sentiment Conditions in the ZB contract (30yr bonds), the ZN contract (10yr bonds), and the Japanese Yen, which is historically highly correlated with bonds. These screenshots show that Commercials are expecting rates to top about now (and bonds bottom), while retail traders, who are almost always wrongly positioned at major trend changes, think that rates will continue to aggressively rise. Premium Plan subscribers receive Sentiment Conditions screenshots on many tradable items nightly.
Every Wednesday and Sunday, we provide EWP Screenshots to subscribers (Basic Plan and up) on over two dozen popular trading instruments. The following are the last nine of those for the S&P-500, starting Feb 23, 2022, the day before the first shots were fired in the Russia – Ukraine war:
Thank You New Email Subscribers! Here’s More Info About Our Paid Subscription Coverage

Thank You New Email Subscribers! Here’s More Info About Our Paid Subscription Coverage
Thank you for signing up for Elliott Wave Plus emails! We try to keep subscribers up to date on what’s going on here at ElliottWavePlus.com without flooding your inbox. Today we would like to show you an inside look at the Pro Plan and Premium Plan subscriptions. As a thank you, we will throw in some bonus material on Crypto currencies, specifically Bitcoin’s Elliott Wave roadmap – a $25 value.
Free In-Depth Look At Our Nightly Algo Report
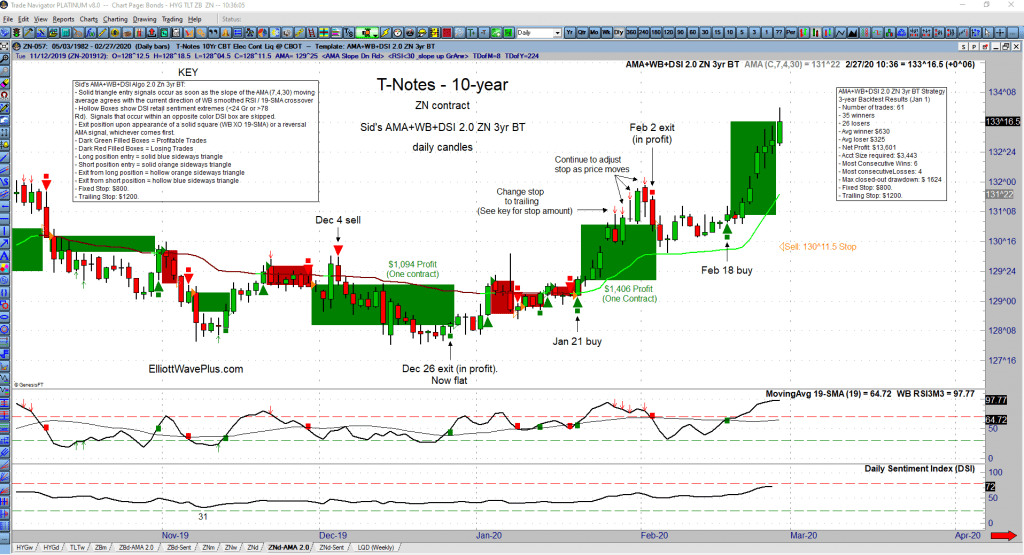
We’d like to give you a more in depth look at an AMA momentum algo chart that our Premium Plan subscribers received last night, as well as the associated sentiment conditions screenshot and PDF “quick check” summary. All of those items are provided to to Premium Plan subscribers nighty (M-F).
Have We Reached An Unsustainable Situation?

Gold & Bonds are typically correlated. As of this writing, that historic relationship appears to be intact. Compare that to Gold & the U.S dollar. Those two items typically move opposite (inverse) of each other. However, since mid-July 2019, they have generally been moving up and down together.
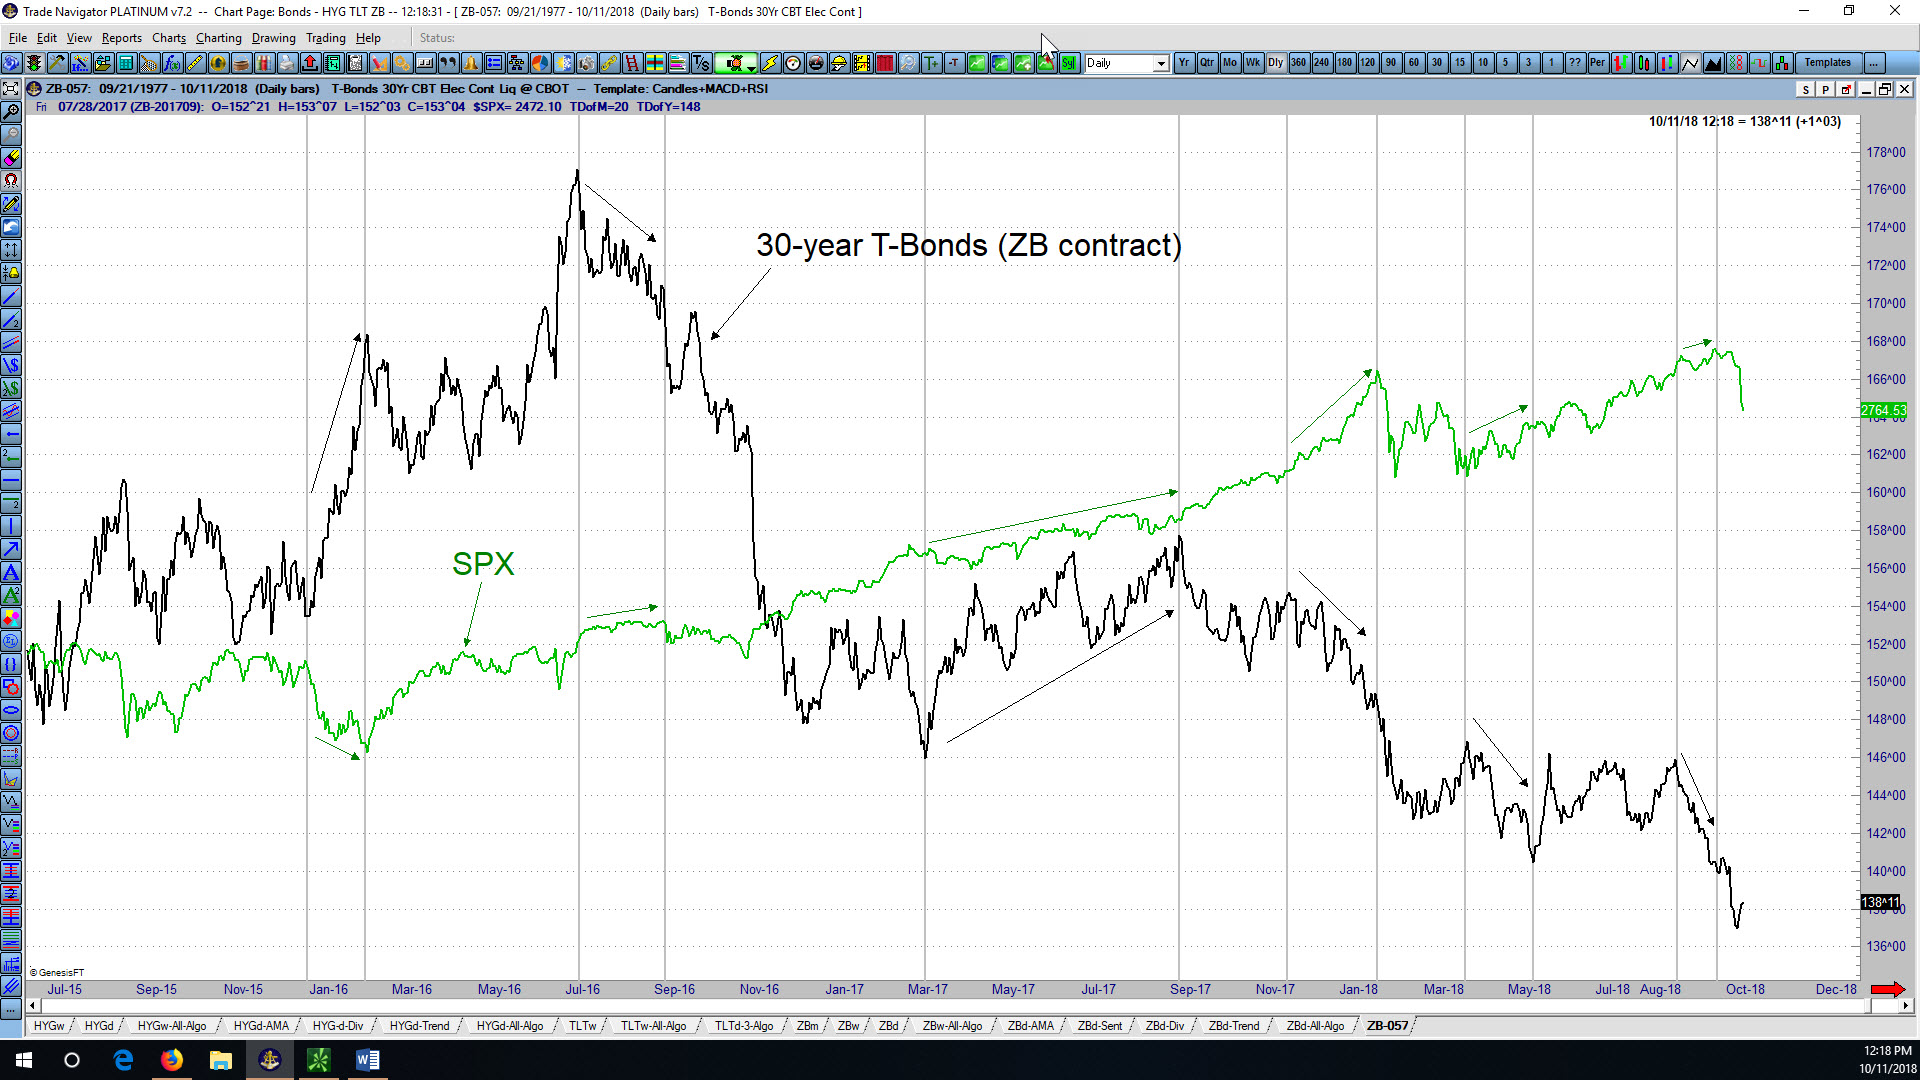
Bonds, which are the most popular alternative to stock ownership in the investment world, typically move opposite of the stock market. However, ever since the start of the new year (2020), stocks, bonds, gold and the US Dollar have all been rallying together. Is this a distortion that has developed because of mid-October 2019 Fed announcement of QE? Many think so. If so however, there was a delayed reaction of 2.5 months.
How To Spot Fake Financial News
Wouldn’t it be nice to see a financial news report that simply reported the facts? For instance, the following would be an example of accurate reporting: “The stock market was down X percent today.” But the following is how financial media always reports the news: “The stock market was down X points today on {insert a rationale here}.” Stating ANY REASON for movements in the stock market is more than suspect. It is the perfect example of fake news.
Elliott Wave Analysis of 30-Year Treasury Bonds (ZB futures contract) by Sid from ElliottWavePredictions.com
Elliott Wave Analysis of 30-Year Treasury Bonds (ZB futures contract) by Sid from ElliottWavePredictions.com. Click on the charts to enlarge. Taking a short break from the stock market, here’s my current technical analysis of the ZB futures contract (30-year bonds). As shown in the lower left corner of the monthly chart above, the last large-degree […]
Elliott Wave Analysis of the USD/JPY Currency Pair and 30yr T-bonds by Sid from ElliottWavePredictions.com
Elliott Wave Analysis of the USD/JPY Currency Pair and 30yr T-bonds by Sid from ElliottWavePredictions.com. Click on the charts twice to enlarge. Since the May 22 high, the USD/JPY currency pair has exhibited what is likely to be a final zigzag to the downside to complete blue wave 2. The zigzag started with a 5-wave […]
Elliott Wave Analysis of the 30-yr T-Bonds (ZB futures contract) by Sid from ElliottWavePredictions.com
Elliott Wave Analysis of the 30-yr T-Bonds (ZB futures contract) by Sid from ElliottWavePredictions.com. Click on the chart twice to enlarge. The sideways choppy price action in bonds since September 23 appears to possibly have been carving out a triangle, which may now be near completion. Triangles are followed by an aggressive thrust, and the […]