Sid’s Elliott Wave Analysis of McEwen Mining Inc. (ticker symbol MUX)
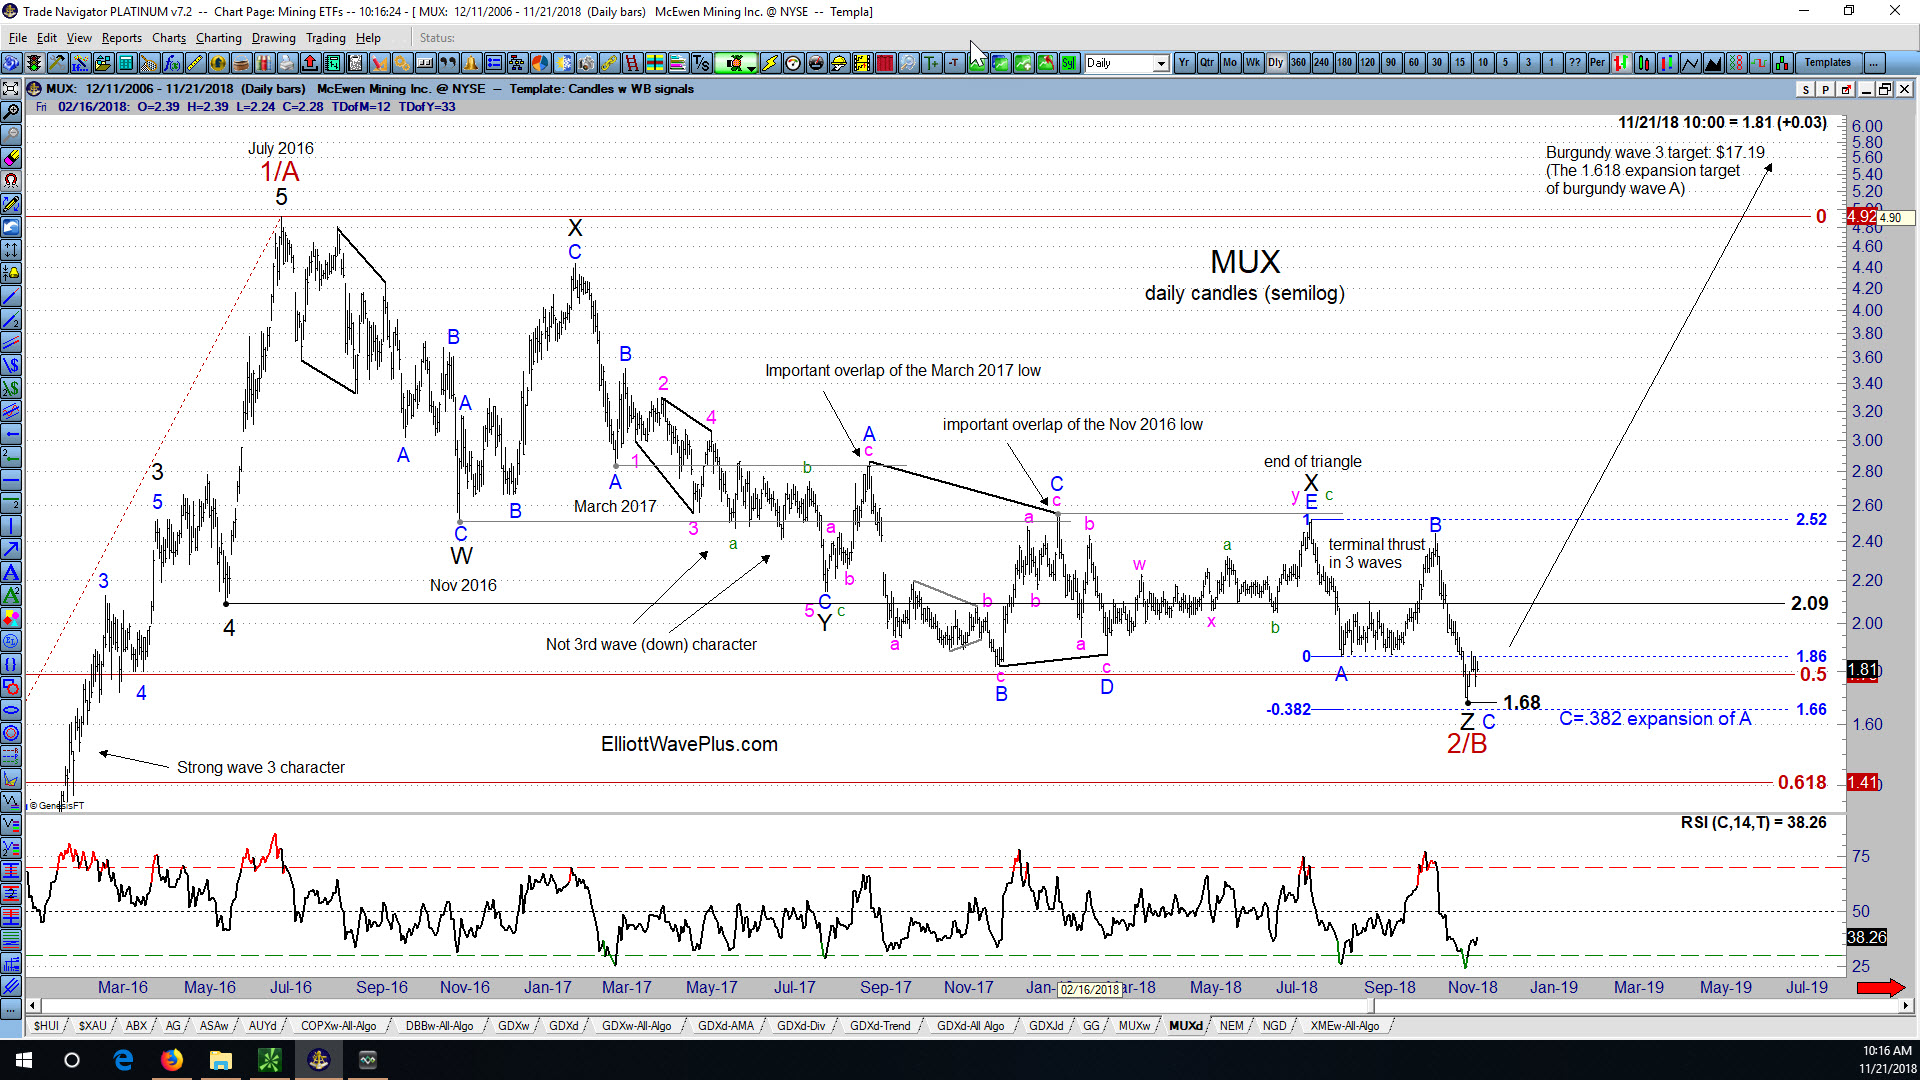
After my recent post on First Majestic Silver Corp. (AG), I’ve received a number of requests for my current wave count on McEwen Mining Inc. (MUX), another highly regarded stock in the precious metals mining sector.
Sid’s Elliott Wave Analysis of First Majestic Silver Corp (ticker symbol AG)
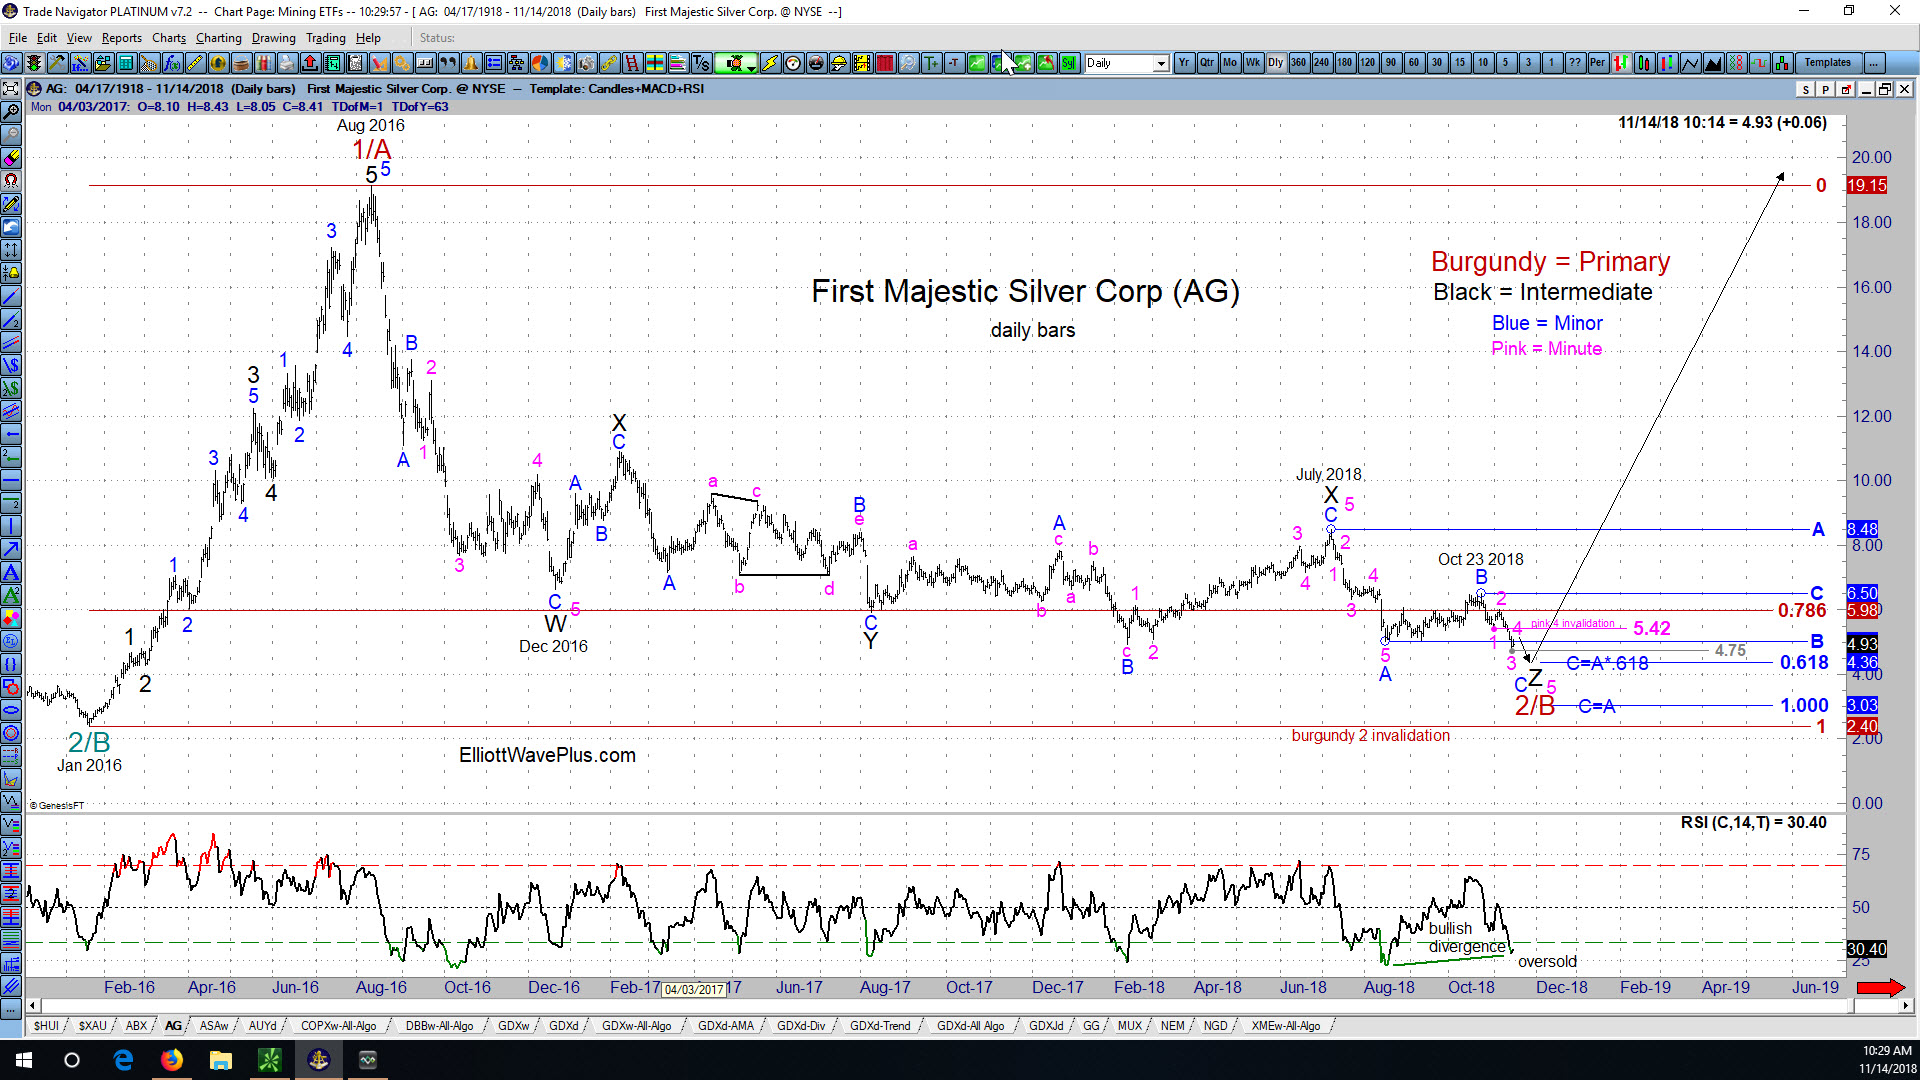
Since AG’s August 2011 high of $26.88, the company’s stock price tumbled all the way down to $2.40 per share in January 2016. Let’s look at the price action in AG starting at that January 2016 low from an Elliott Wave perspective. (Click on the chart to enlarge)
A Chartist’s View of New Gold Inc. (ticker NGD)

New Gold Incorporated is a mid-tier gold mining company with mining operations in Canada, the U.S. and Mexico. NGD stock made its all-time low of 74 cents per share in December 2008, and its all-time high of $14.15 per share in September 2011. New Gold is one of the holdings in the two most popular gold mining ETF’s, GDX and GDXJ. Its annual revenue is currently about $725 million. Let’s examine a chart of NGD starting at the 2011 high from a technical point of view.
The Current State of the US Stock Market, the US Dollar, and Gold. A free blog post by Sid Norris of ElliottWavePlus.com
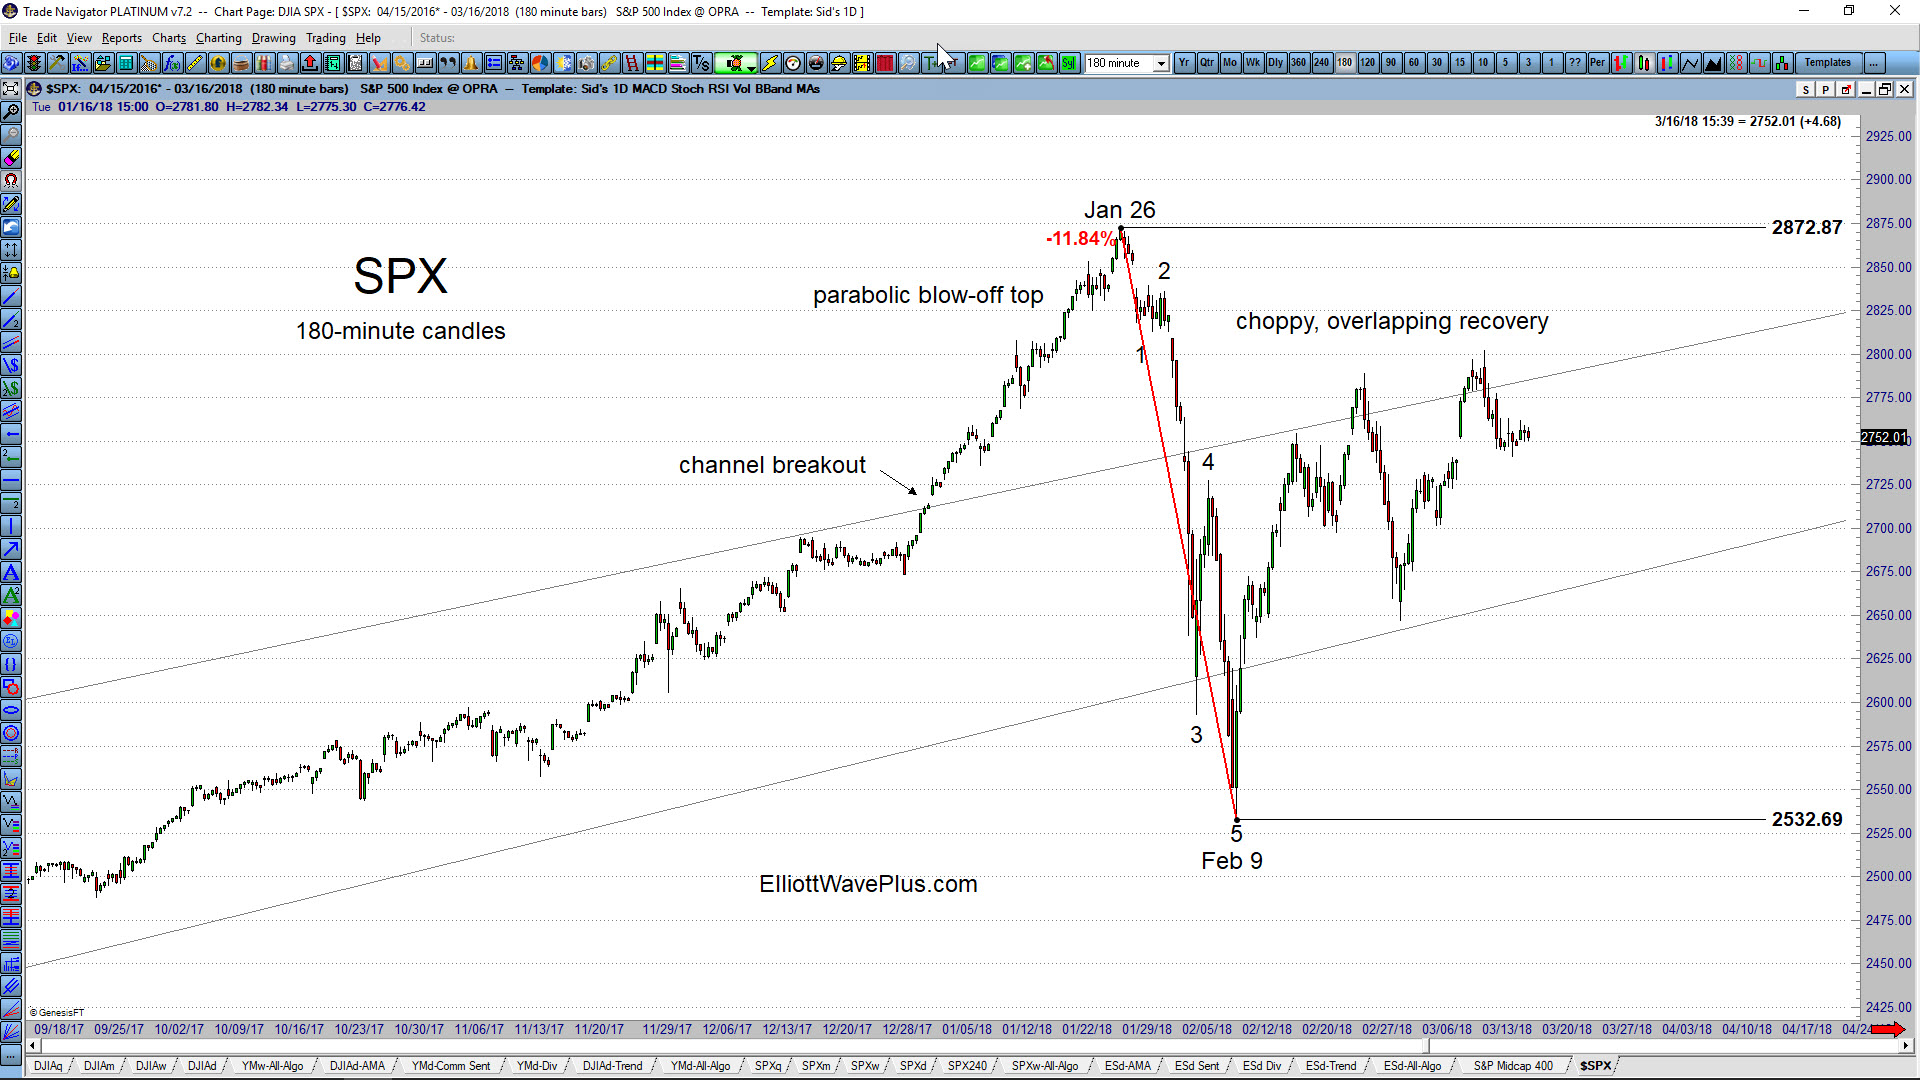
The S&P-500: The January rise in the US stock market went parabolic before topping on January 26. The 11.84% drop over the next 2 weeks (thru February 9) carved out a clear 5-wave impulse to the downside. The recovery so far appears to be choppy, overlapping, and corrective. From an Elliott Wave perspective, the aggressive move down thru Feb 9 is therefore very likely to be a wave 1 of a new downtrend, or a wave A within a 4th wave zigzag. Therefore, another 5-wave wave structure to the downside, taking out the Feb 9 low of 2532.69 would be a high probability expectation. Also possible within Elliott Wave theory is that the drop from Jan 26 thru Feb 9 was wave A within a wave 4 triangle. Only 4 of the 5 legs of a triangle are required to be a zigzag or zigzag combination. One of the legs can be something else, including a 5-wave impulse.
What’s Next for the US Dollar? (by Sid Norris of ElliottWavePlus.com)
The US Dollar has been quite weak since the beginning of last year. Will it continue to weaken? The monthly chart below shows my long-time main Elliott Wave count for the US Index, an unfinished ending contracting diagonal starting at the 1985 high. This wave count correctly expected the US Dollar to top near a .618 retacement of the downward wave from July 2001 through March 2008. That top came in early January 2017, and the Dollar has surprised many by moving strongly lower ever since. Hurst cycle analysis also correctly projected that top, and from a long-term perspective is quite bearish the Dollar moving forward, potentially all the way to the year 2027.
An Important Large-Cap Gold-Mining Stock (ABX) is Still Searching for a Bottom
Gold, Silver and Platinum were up big again on a “Fed” day yesterday, a recurring motif in recent quarters. Yesterday’s bounce was fairly large, especially in many of the large and mid-cap precious metals mining stocks. I’ve been projecting for a long time that a large cycle trough was due near year-end 2017, so is the bottom in on precious metals or not? Let’s take a look.
Precious Metals and Mining Stocks Were Up Big Yesterday. Is the Bottom “In”?
Gold, Silver and Platinum were up big again on a “Fed” day yesterday, a recurring motif in recent quarters. Yesterday’s bounce was fairly large, especially in many of the large and mid-cap precious metals mining stocks. I’ve been projecting for a long time that a large cycle trough was due near year-end 2017, so is the bottom in on precious metals or not? Let’s take a look.
Video Highlight from Sid’s May 29, 2016 “Counts” Webinar – featuring GDX
The following is a two-minute video clip highlight from my May 29, 2016 “Counts” Webinar. This clip features coverage of GDX. Please join me for my Weekly “Counts” Webinar, where I go over all of my Elliott Wave counts and associated Fibonacci price targets for many of the world’s major stocks markets, commodities, currencies, and […]
Updated Elliott Wave Analysis of ASA by Sid from ElliottWavePredictions.com
Updated Elliott Wave Analysis of ASA by Sid from ElliottWavePredictions.com. Click on the charts to enlarge. Back on July 2nd, I posted a workup on ASA Gold and Precious Metals Limited. Since then, ASA has continued lower, and yesterday reached a significant Fibonacci target of $8.94, where wave 5 blue equaled the net traveled by […]
Elliott Wave Analysis of ASA (Gold & Silver Stocks) by Sid from ElliottWavePredictions.com
Elliott Wave Analysis of ASA (Gold & Silver Stocks) by Sid from ElliottWavePredictions.com. Click on the charts to enlarge. From Yahoo Finance: “ASA Gold and Precious Metals Limited is ASA a self management investment trust. The firm invests in the public equity markets across the globe. It primarily invests in stocks of companies engaged in […]

