When the Stock Market Goes Down, Gold Goes Up. Right?

During the Jan 19 webinar, Sid showed an intermediate-term chart of Gold and the S&P-500 Index, one overlaid upon the other. The chart clearly showed that gold and the stock market don’t always move inversely, as many seem to believe. Sometimes the two items move opposite each other, but other times they generally move together, in positive correlation. For instance, since early October 2019, the two items have generally been moving to the upside together.
This video clip, taken from that January 19 weekly “Counts” webinar includes Sid’s discussion of the above myth, as well as his chart of Gold vs. the S&P. For those who believe that Gold will “save them” when the stock market crashes next, the video is worthy of consideration.
Are there potential trading profits to be made on both the upside and downside of the S&P as well as Gold? Absolutely. But the two items really should be analyzed and traded independently.
Bonus screenshot from the January 26 weekly webinar. Notice how highly correlated the S&P and the XAU (Gold & Silver Sector Index) have been since early October.
My Current Analysis of the S&P-500 by Sid Norris from ElliottWavePlus.com

From an Elliott Wave perspective, my top two wave counts are shown. The main count is that an incomplete expanding leading diagonal to the downside is underway starting at the September 21 all-time high. The alternate (shown with question marks) is that an intermediate degree (black) wave 5 to the upside commenced at the December 24 low.
Sid’s Sentiment Algo. How and Why it Works.
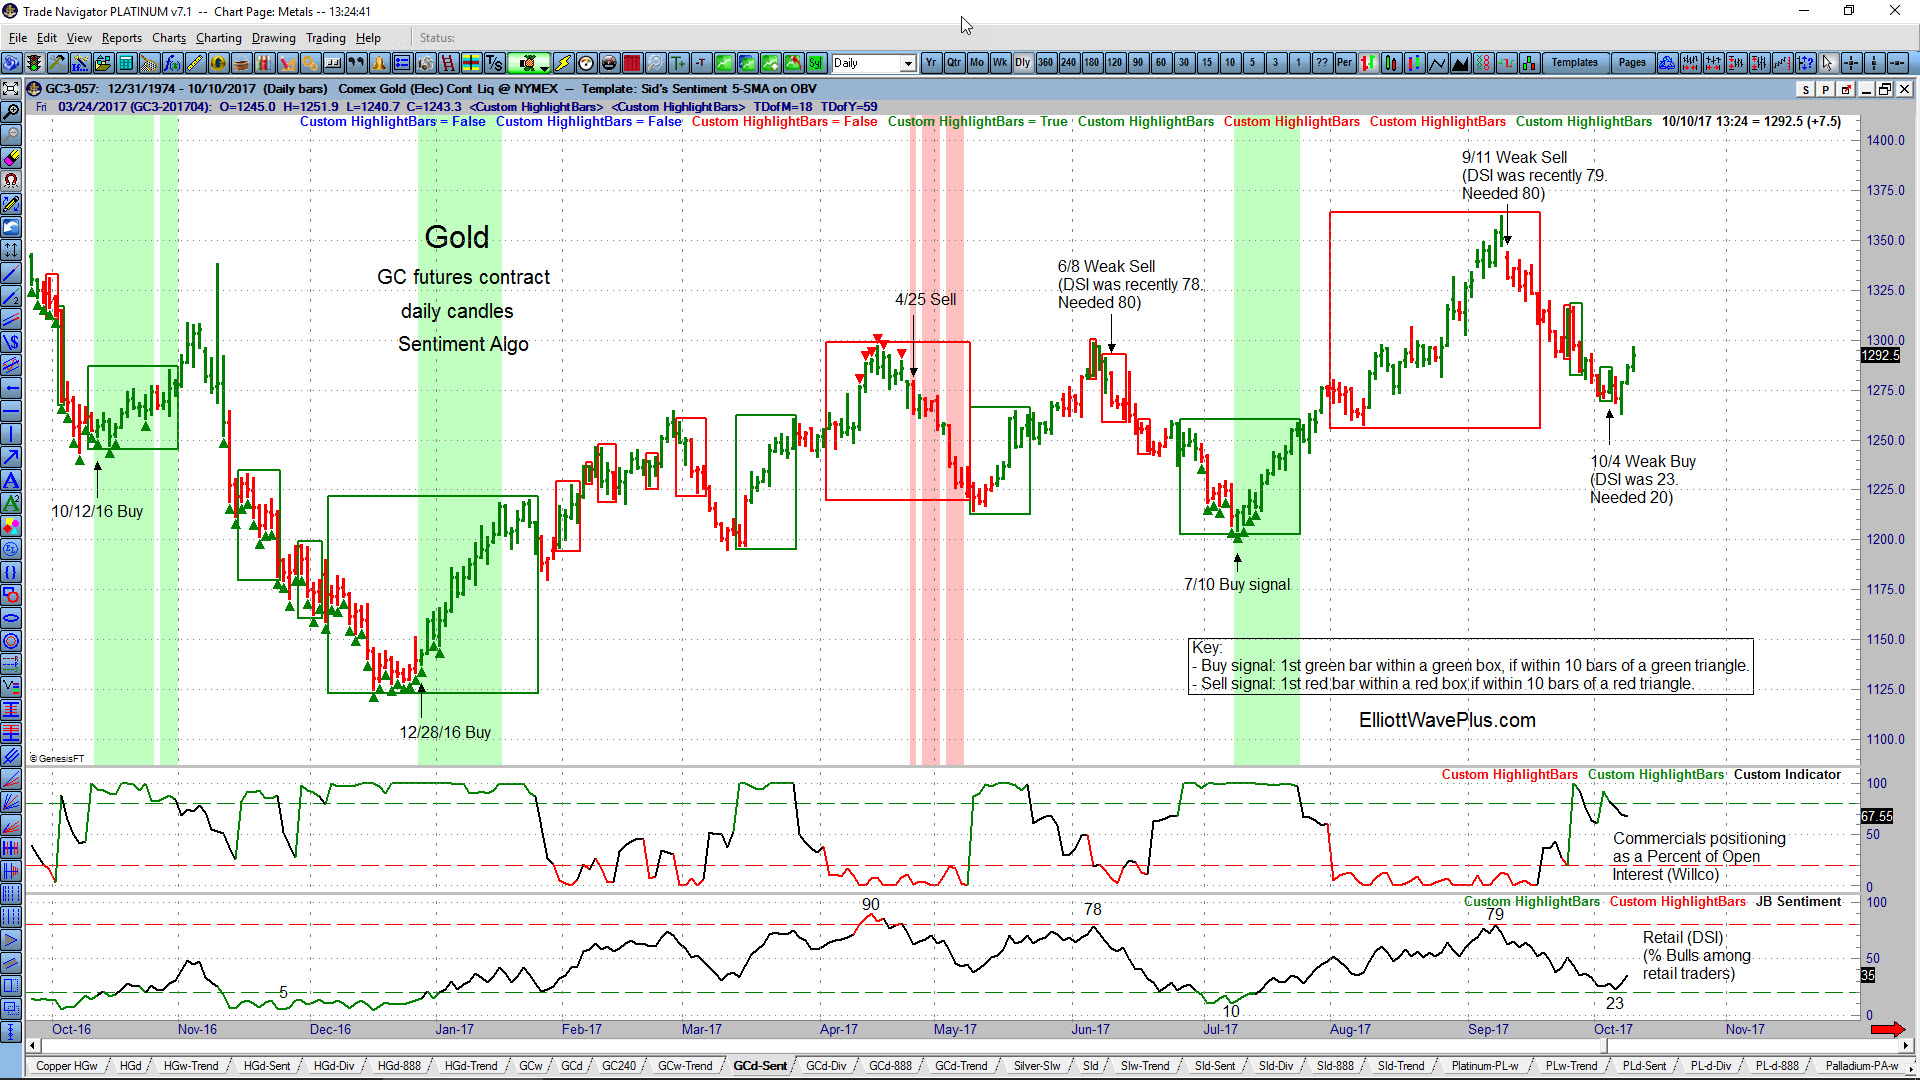
In the following video, Sid Norris of Elliott Wave Plus shows the latest revision of his Sentiment Algo, how it was constructed, and how well it has marked several trend changes in the S&P-500 and Gold over the past year.
How Sid Norris of ElliottWavePredictions.com Correctly Forecasted Market Direction Both Before and After the Brexit Vote
How I Correctly Forecasted Market Direction Both Before and After the Brexit Vote: Many traders have been surprised by two events recently. First, the surprise Brexit vote on Friday, June 22 (overnight, before the US markets opened), and second, the surprise stock market bounce starting on Tuesday, June 26. Here are the EXACT communications I sent out […]
Highlights from Sid’s January 10, 2016 “Counts” Webinar – from ElliottWavePredictions.com
Highlights from Sid’s January 10, 2016 “Counts” Webinar, featuring the Dow Jones Industrial Average and S&P-500 – from ElliottWavePredictions.com. A week ago, I posted highlights from the January 3 “Counts” webinar, indicating that I thought the week of Jan 4-8 would be a strong down week in the stock markets. As it turned out, the […]
Sid’s Combined Elliott Wave & Hurst Cycle Analysis of the S&P-500 (SPX) from his January 3, 2016 “Counts” Webinar – ElliottWavePredictions.com
Sid’s Combined Elliott Wave & Hurst Cycle Analysis of the S&P-500 (SPX) from his January 3, 2016 “Counts” Webinar – ElliottWavePredictions.com. The 5-minute video clip below is from my January 3, 2016 “Counts Webinar. Did your current subscription service predict strong downside continuation to new lows below the November and December lows in stocks this […]
Replay of the November 30 Hurst Cycles Webinar – Sid Norris, guest presenter
I had the distinct pleasure of appearing as the guest presenter in yesterday’s weekly Hurst cycles webinar. David Hickson, the creator of Sentient Trader software typically holds these free webinars every Monday and was kind enough to invite me to participate as guest presenter. During the webinar, I discuss why I consider October 2011 to […]
Elliott Wave Analysis of the Nasdaq 100 Index ETF (QQQ) by Sid from ElliottWavePredictions.com
Elliott Wave Analysis of the Nasdaq 100 Index ETF (QQQ) by Sid from ElliottWavePredictions.com. Click on the charts to enlarge. There are several ways to track the Nasdaq. Today I’m showing the Powershares QQQ Trust, which generally tracks with the Nasdaq 100 Index. First, let’s take a look at a long-term (monthly) chart: The most […]
Elliott Wave Analysis of the S&P-500 (SPX) by Sid from ElliottWavePredictions.com
Elliott Wave Analysis of the S&P-500 (SPX) by Sid from ElliottWavePredictions.com. Click on the chart twice to enlarge. After plunging 12.48% from May 20 through August 24, the S&P-500 it has now recovered over 84% of that drop. Will the rally continue? There are several technical signs the market may be ready to roll over again: […]
Have We Seen the Top in the S&P-500? Let’s Take a Look . .
Have we seen the top in the S&P-500? Possibly, but not quite yet in my opinion. As you all know, I utilize a combination of several technical analysis tools to predict price movements in the markets. Those tools include Elliott Wave and its associated Fibonacci price targets, Hurst cycle analysis, MACD divergence, RSI overbought/oversold, support […]

