Sid’s Elliott Wave Analysis of First Majestic Silver Corp (ticker symbol AG)
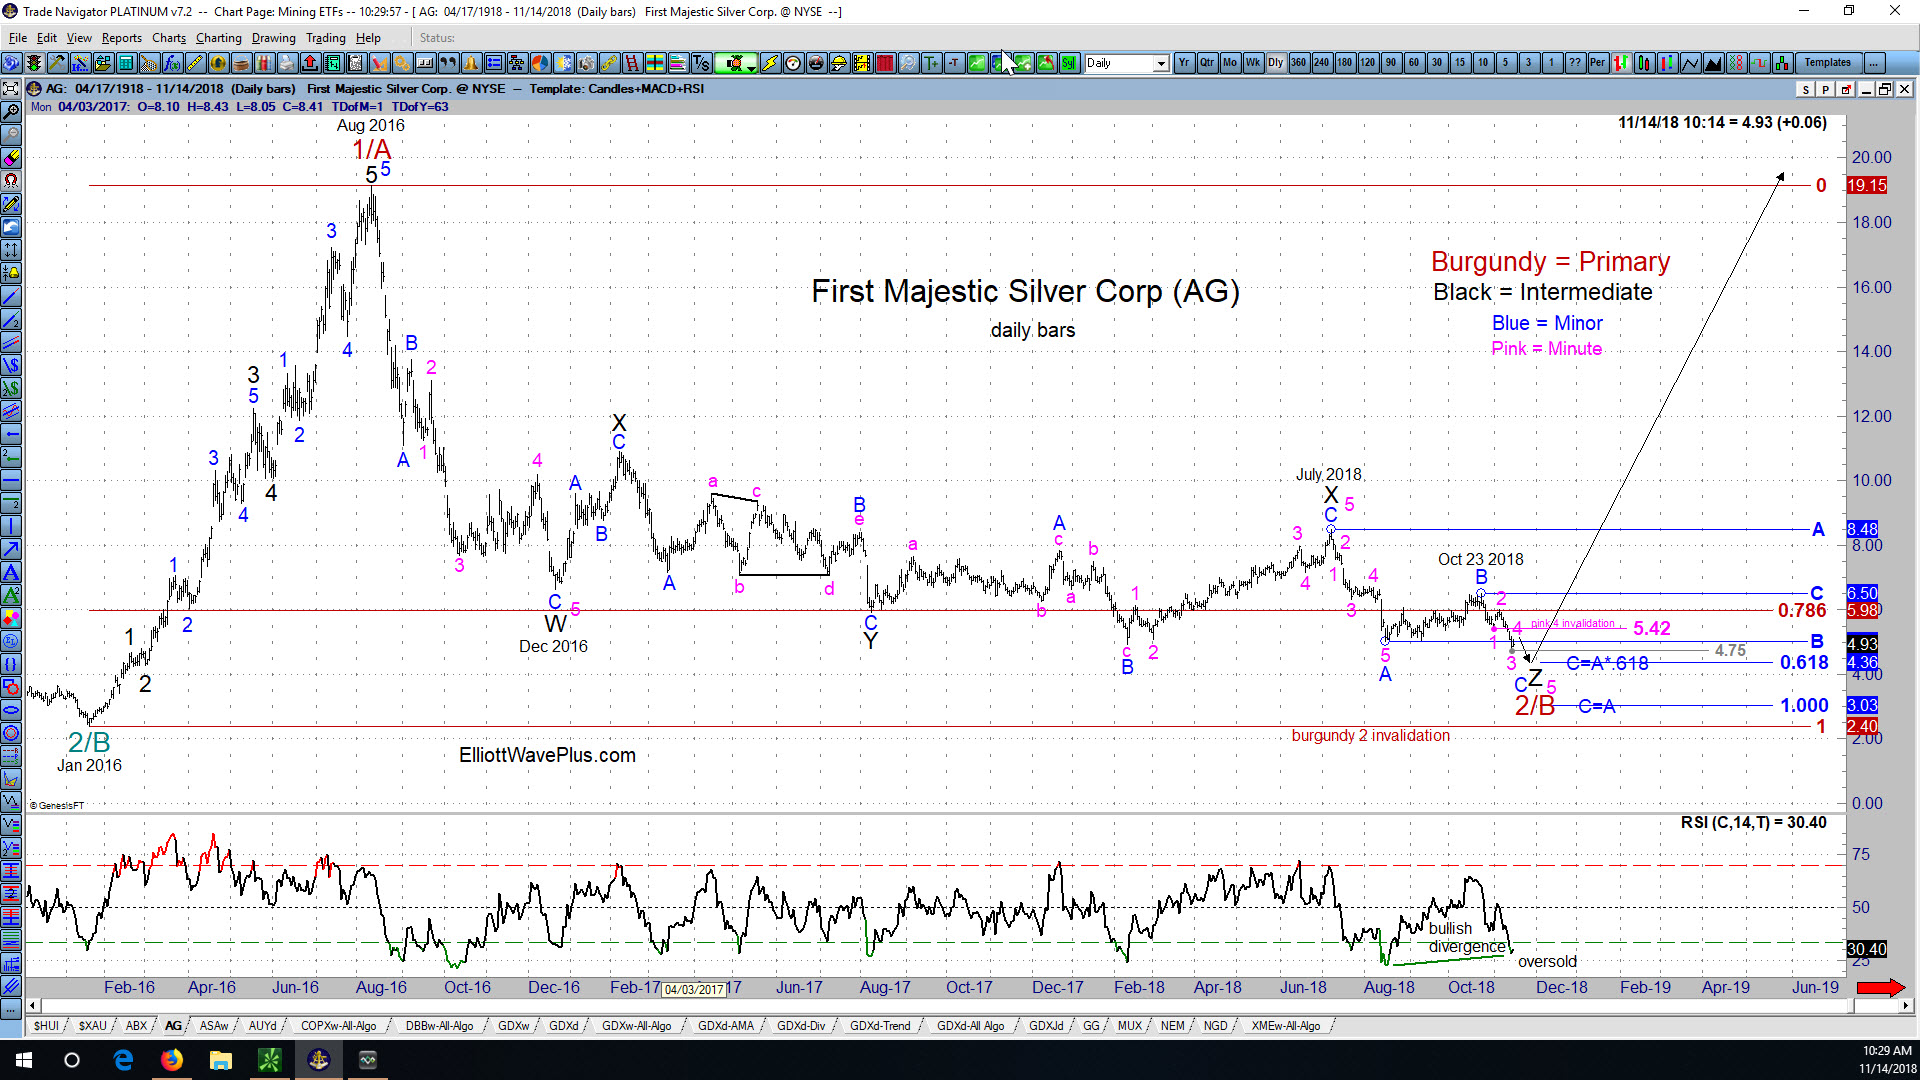
Since AG’s August 2011 high of $26.88, the company’s stock price tumbled all the way down to $2.40 per share in January 2016. Let’s look at the price action in AG starting at that January 2016 low from an Elliott Wave perspective. (Click on the chart to enlarge)
How To Spot Fake Financial News
Wouldn’t it be nice to see a financial news report that simply reported the facts? For instance, the following would be an example of accurate reporting: “The stock market was down X percent today.” But the following is how financial media always reports the news: “The stock market was down X points today on {insert a rationale here}.” Stating ANY REASON for movements in the stock market is more than suspect. It is the perfect example of fake news.
A Chartist’s View of New Gold Inc. (ticker NGD)

New Gold Incorporated is a mid-tier gold mining company with mining operations in Canada, the U.S. and Mexico. NGD stock made its all-time low of 74 cents per share in December 2008, and its all-time high of $14.15 per share in September 2011. New Gold is one of the holdings in the two most popular gold mining ETF’s, GDX and GDXJ. Its annual revenue is currently about $725 million. Let’s examine a chart of NGD starting at the 2011 high from a technical point of view.
Sid’s timely call on Natural Gas during the May 14, 2017 weekly “Counts” Webinar

Sid’s Timely Call on Natural Gas (NG Futures Contract) During his May 14, 2017 Weekly “Counts” Webinar. Each week, Sid Norris of ElliottWavePlus.com holds a Sunday webinar for “Pro Plan” subscribers. During the session, he presents his Elliott Wave counts and associated Fibonacci price targets for many of the world’s major stock markets, commodities, currencies, […]
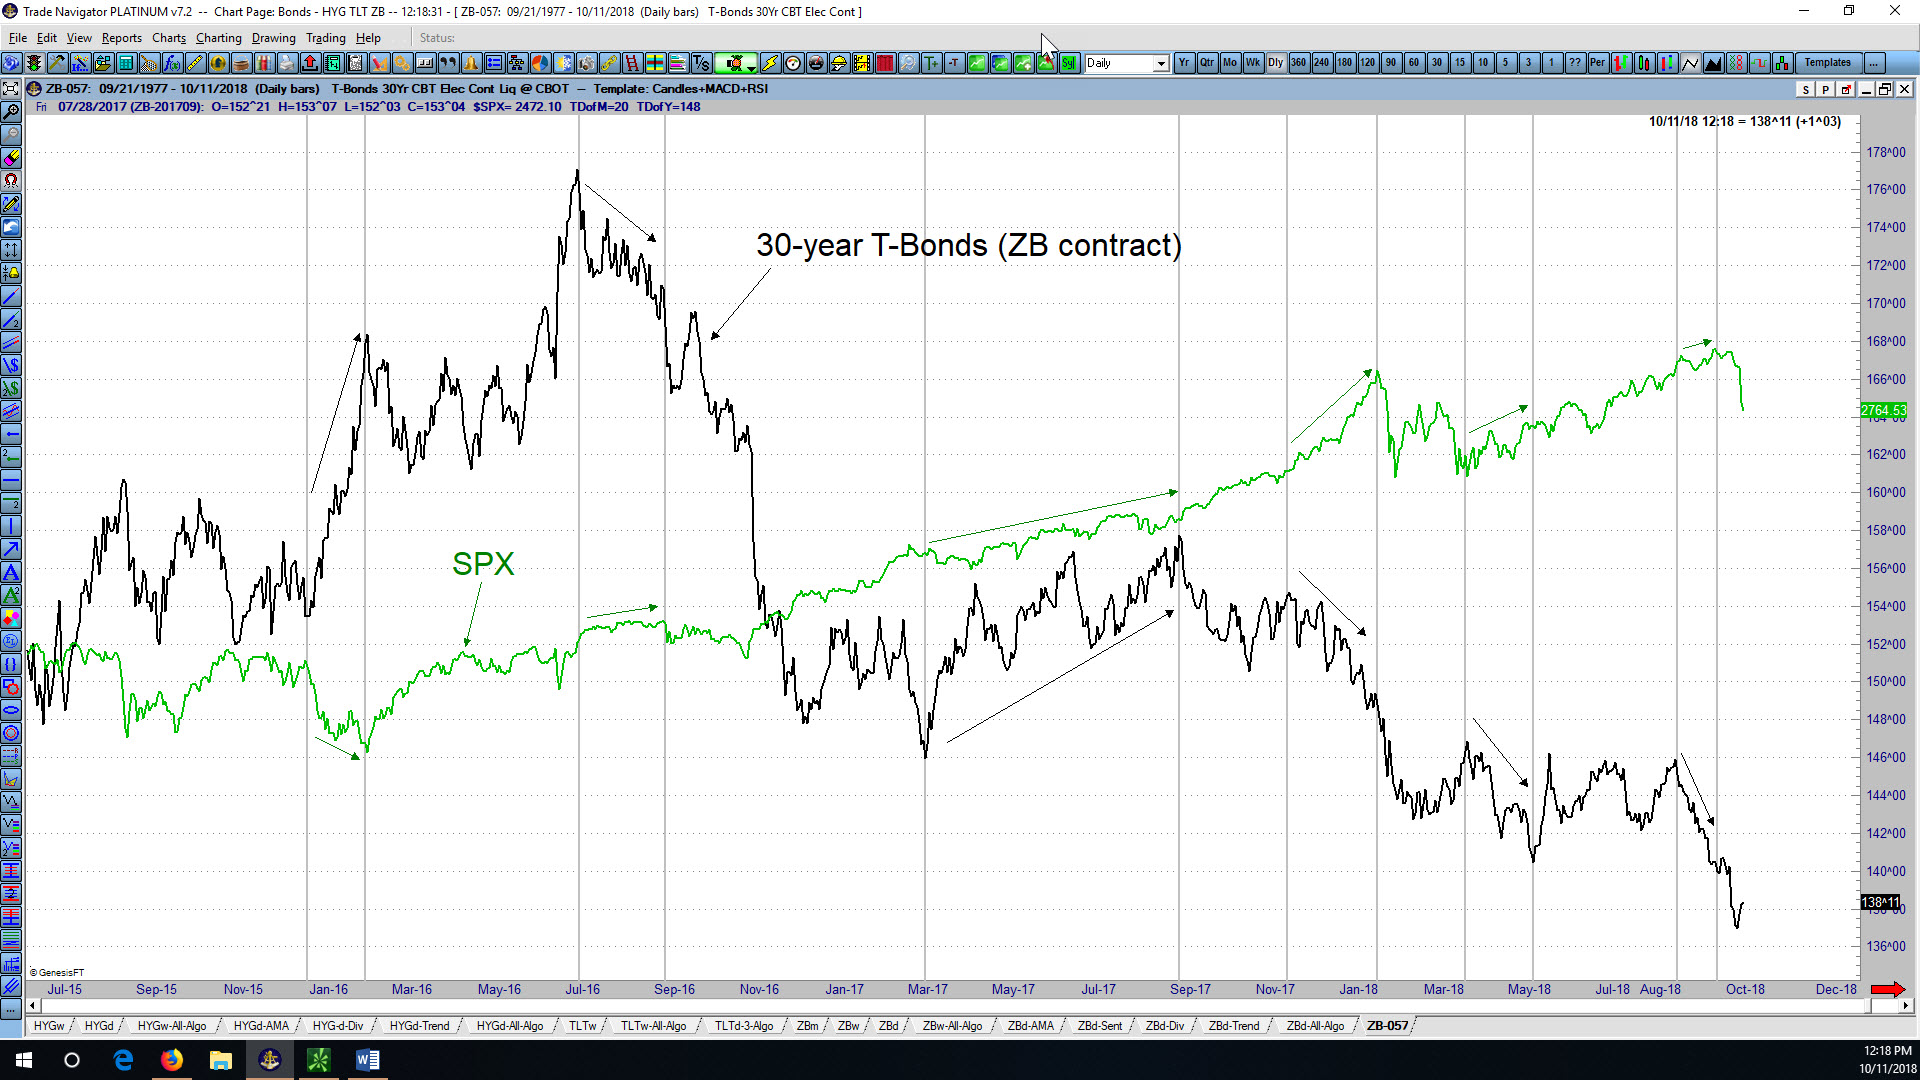
Elliott Wave Analysis of 30-Year Treasury Bonds (ZB futures contract) by Sid from ElliottWavePredictions.com
Elliott Wave Analysis of 30-Year Treasury Bonds (ZB futures contract) by Sid from ElliottWavePredictions.com. Click on the charts to enlarge. Taking a short break from the stock market, here’s my current technical analysis of the ZB futures contract (30-year bonds). As shown in the lower left corner of the monthly chart above, the last large-degree […]
Technical Analysis of Silver Wheaton Corp. (ticker: SLW) by Sid from ElliottWavePredictions.com
Technical Analysis of Silver Wheaton Corp. (ticker: SLW) by Sid from ElliottWavePredictions.com. Silver Wheaton (SLW) is showing clear signs that it’ll be producing a 5-wave, non-overlapping Elliott Wave impulse to the upside from its November 11 low. The 60-minute chart really tells the tale, as an almost unmistakeable wave 4 (pink) triangle is forming. The […]
Elliott Wave & Hurst Cycle Analysis of Silver (XY futures contract), & the US Dollar (DX Index) by Sid from ElliottWavePredictions.com
Elliott Wave & Hurst Cycle Analysis of Silver (XY futures contract), & the US Dollar (DX Index) by Sid from ElliottWavePredictions.com. Click on the charts to enlarge. By utilizing a combination of Elliott Wave and Hurst Cycle Analysis, I believe silver will put in a significant bottom in about 3 weeks. As the daily chart […]
Elliott Wave Analysis of Copper (QC futures contract) and the Baltic Dry Index by Sid from ElliottWavePredictions.com
Elliott Wave Analysis of Copper (QC futures contract) and the Baltic Dry Index by Sid from ElliottWavePredictions.com. Click on the charts twice to enlarge. Here are two ominous indications that a more aggressive phase of the deflationary downturn in the global economy has just gotten underway. Copper appears to have begun a thrust from a […]
Elliott Wave Analysis of the Dow Jones Industrial Average (DJIA) by Sid from ElliottWavePredictions.com
Elliott Wave Analysis of the Dow Jones Industrial Average (DJIA) by Sid from ElliottWavePredictions.com. Click on the chart twice to enlarge. Wave C blue continues upward, with virtually all of the upward movement over the last 3 weeks created during three overnight sessions. As shown on the chart, the US equity markets have now reached […]
Elliott Wave Analysis of the S&P-500 (SPX) by Sid from ElliottWavePredictions.com
Elliott Wave Analysis of the S&P-500 (SPX) by Sid from ElliottWavePredictions.com. Click on the chart twice to enlarge. This last push to the upside appears to be pointing to 1279 on January 3rd/4th, needing only to complete wave 5 pink to the upside, as shown. If this count is correct, the high for 2012 in […]