Accurate Predictive Technical Analysis
Elliott Wave Plus continues its hot streak when it comes to technical analysis and future roadmaps on multiple stocks and sectors.
Quarterly Premium Plan Webinar and Sortable Spreadsheet – Aug 4, 2022
We believe our sentiment condition screenshots are so amazingly valuable to traders, we wanted to spend some time showing viewers how to read those charts, and how to utilize them in your trading. These charts show DSI (retail positioning), and multiple measures of commercials (the producers/hedgers) positioning. As we all know, retail traders are notoriously positioned on the wrong side of trade at major turns. Knowing retail vs commercial is crucial when timing your trades.
All About our Improved Nightly “Sentiment Conditions” Screenshots – from Elliott Wave Plus
It’s time for the Elliott Wave Plus Quarterly Premium Plan Webinar! Our Premium Plan is best known for supplying automated trade signals on about twenty different trade-able instruments to subscribers on a nightly basis. However, our longtime Premium Plan subscribers are telling us that our new, improved nightly “Sentiment Conditions” screenshots are easily worth the price of the subscription alone. See for yourself! We’ll spend most of the time in this online seminar revealing all aspects of our new improved Sentiment Conditions nightly screenshots. We’ll show how they can help subscribers become better informed about Commercials vs. Retail sentiment positioning, and how that knowledge can be extremely valuable when making trading decisions. Time will be allotted for Q&A.
Are Interest Rates Topping? Has Inflation Peaked?
The following video clip from our April 10, 2022 Weekly Counts Webinar provide timely food for thought on those two questions. Possible conclusions are based on Elliott wave theory and its associated Fibonacci price targets, multi-decades trendlines (on semilog charts), and current sentiment conditions.
Rising Interest Rates and Inflation are all over the news. Conventional expectations of the directional market reactions to news have been consistently wrong. Investors are confused and worried. It’s time to get technical.
Technical analysis eliminates the worry and confusion. It ignores mainstream financial media, and their ridiculous, news-based explanations of why the market moves up and down. Elliott Wave theory, Cycle analysis and Sentiment Conditions are more important to traders and investors now than ever before.
The attached video clip was recorded on Sunday, April 12, and was a small portion of Sid’s Weekly Counts Webinar for ElliottWavePlus.com subscribers (Pro Plan and up).
In the video, Sid Norris examines TNX (bond yields), and TIP (Treasury Inflation Protection bonds). Are rates going to continue to skyrocket unabated? Is the aggressive inflationary period over?
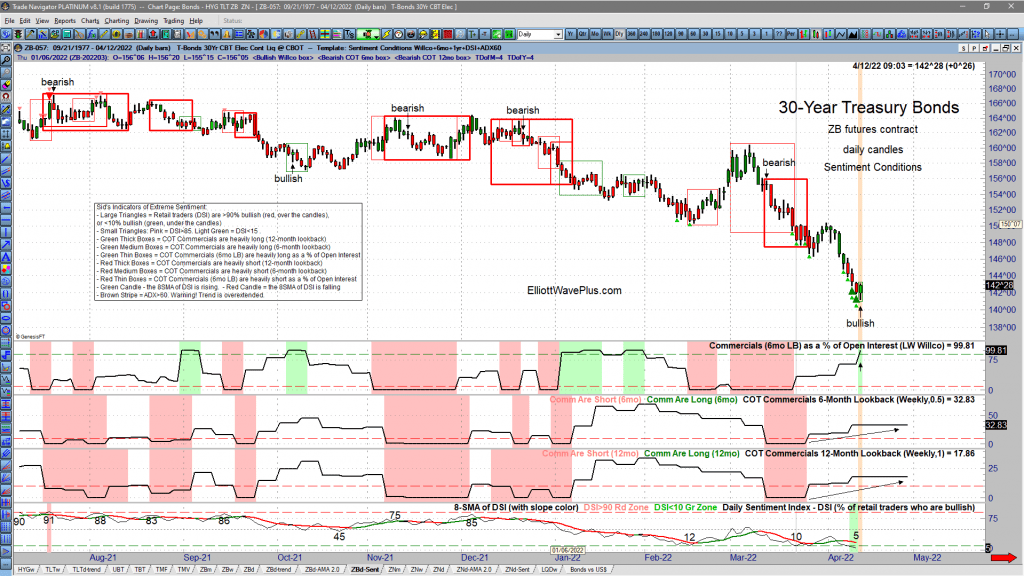
Additional evidence of Sentiment extremes in bonds were presented later in the webinar. Here are current screenshots of current Sentiment Conditions in the ZB contract (30yr bonds), the ZN contract (10yr bonds), and the Japanese Yen, which is historically highly correlated with bonds. These screenshots show that Commercials are expecting rates to top about now (and bonds bottom), while retail traders, who are almost always wrongly positioned at major trend changes, think that rates will continue to aggressively rise. Premium Plan subscribers receive Sentiment Conditions screenshots on many tradable items nightly.
Every Wednesday and Sunday, we provide EWP Screenshots to subscribers (Basic Plan and up) on over two dozen popular trading instruments. The following are the last nine of those for the S&P-500, starting Feb 23, 2022, the day before the first shots were fired in the Russia – Ukraine war:
How Accurate has Elliott Wave Plus been on the S&P-500 recently?
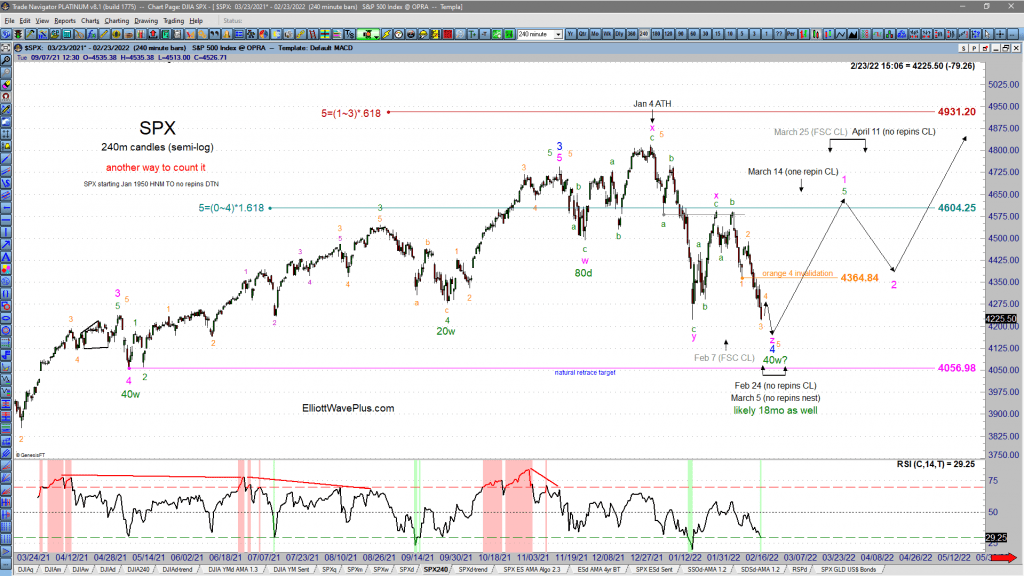
How accurate has Elliot Wave Plus been on the S&P-500 Recently?
Here are our nine most recent EWP Screenshots of Sid’s predictive roadmaps for the S&P-500
Every Wednesday and Sunday, we provide EWP Screenshots to subscribers (Basic Plan and up) on over two dozen popular trading instruments. The following are the last nine of those for the S&P-500, starting Feb 23, 2022, the day before the first shots were fired in the Russia – Ukraine war:
Sid’s Recent Call on GDX (Gold Miners ETF)
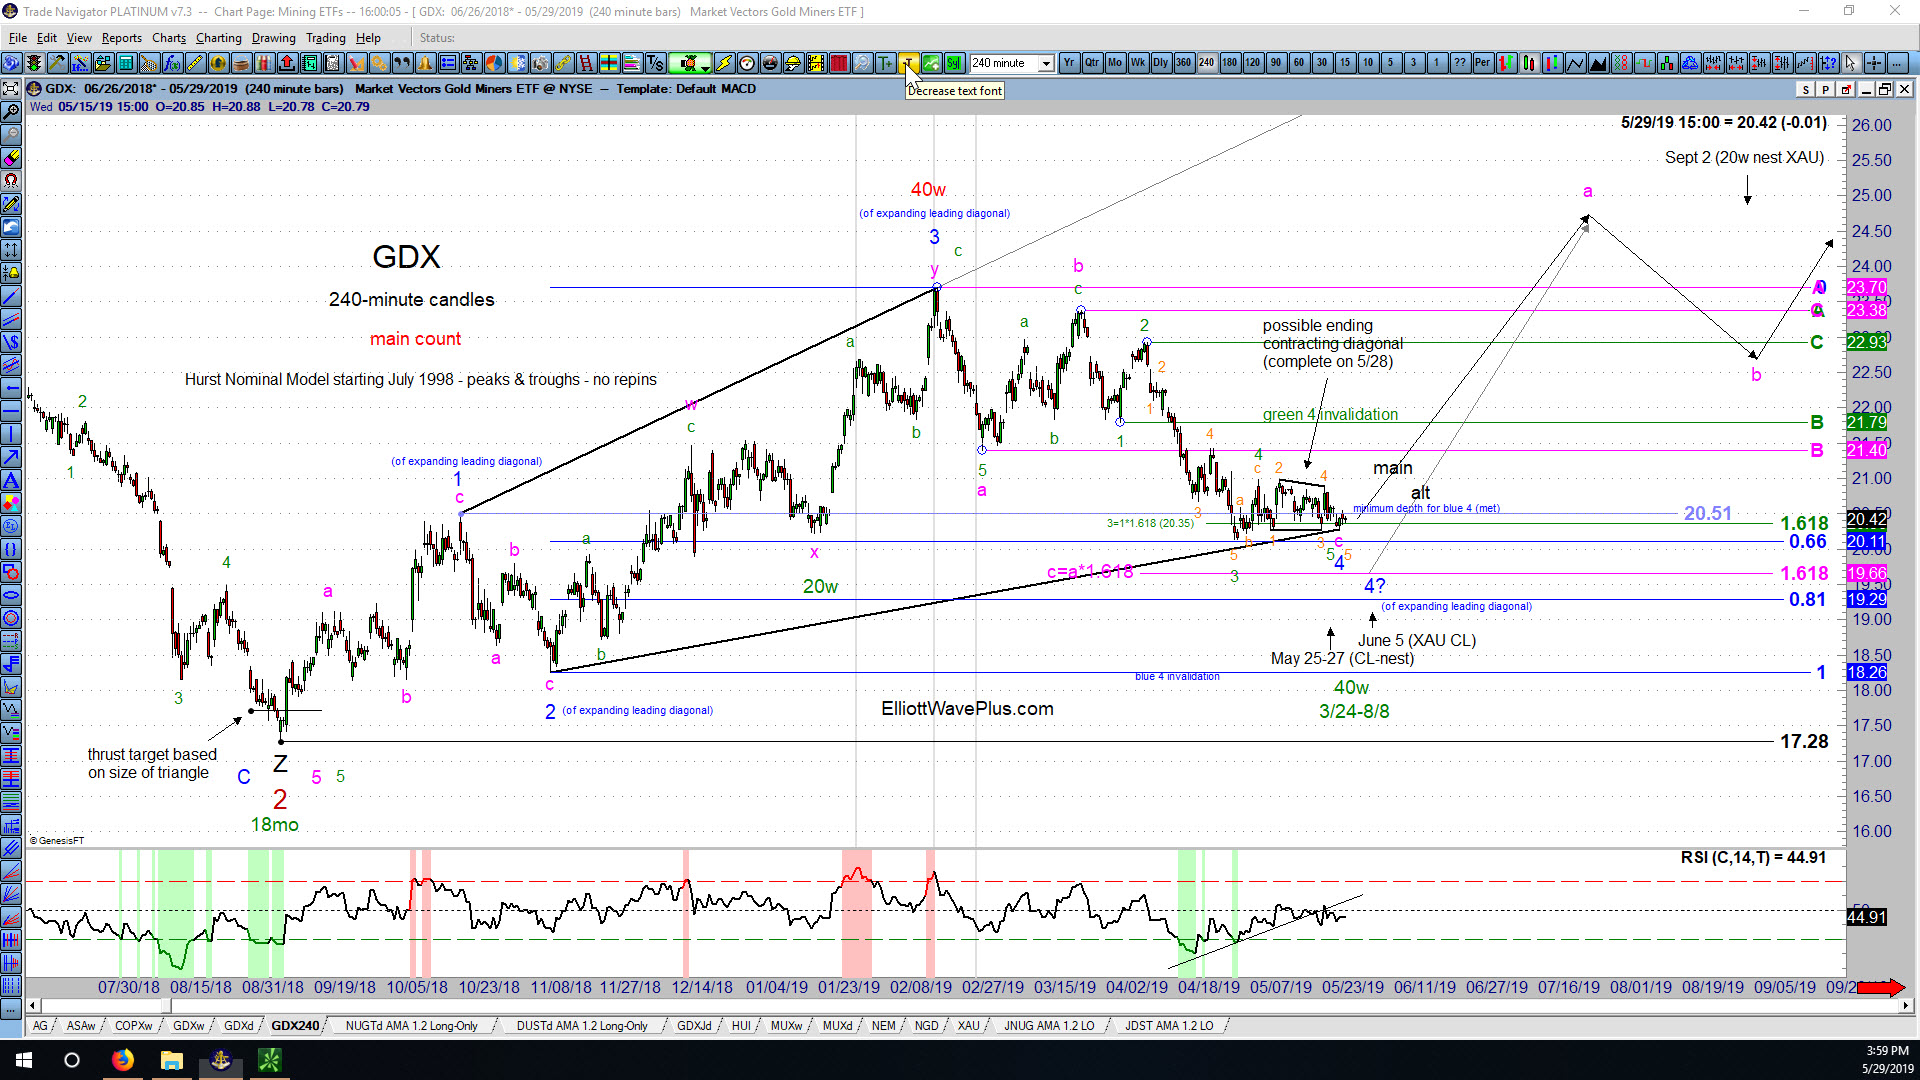
The following screenshot was provided to all Elliott Wave Plus paying subscribers on Wednesday night, May 29, 2019:
Combining Elliott Wave, Fibonacci and Hurst Cycle Analysis to Predict the Future Direction of the Dow Jones Industrial Average

The following charts include my main and alternate wave counts and associated Fibonacci price targets for the Dow Jones Industrial Average, starting with the quarterly, then monthly, weekly and daily charts. Hurst cycle analysis is also utilized at all time frames.
Technical Analysis of the CRB Index (the Commodities Complex) by Sid Norris from ElliottWavePlus.com
The weekly chart (below) of the CRB Index (cash) shows my main Elliott wave count and associated Fibonacci price targets, as well as Cycle analysis, utilizing both the Hurst system and a custom 3.5-year model. (Click on the chart to enlarge).
My Current Analysis of the S&P-500 by Sid Norris from ElliottWavePlus.com
From an Elliott Wave perspective, my top two wave counts are shown. The main count is that an incomplete expanding leading diagonal to the downside is underway starting at the September 21 all-time high. The alternate (shown with question marks) is that an intermediate degree (black) wave 5 to the upside commenced at the December 24 low.
Sid’s Elliott Wave Analysis of McEwen Mining Inc. (ticker symbol MUX)
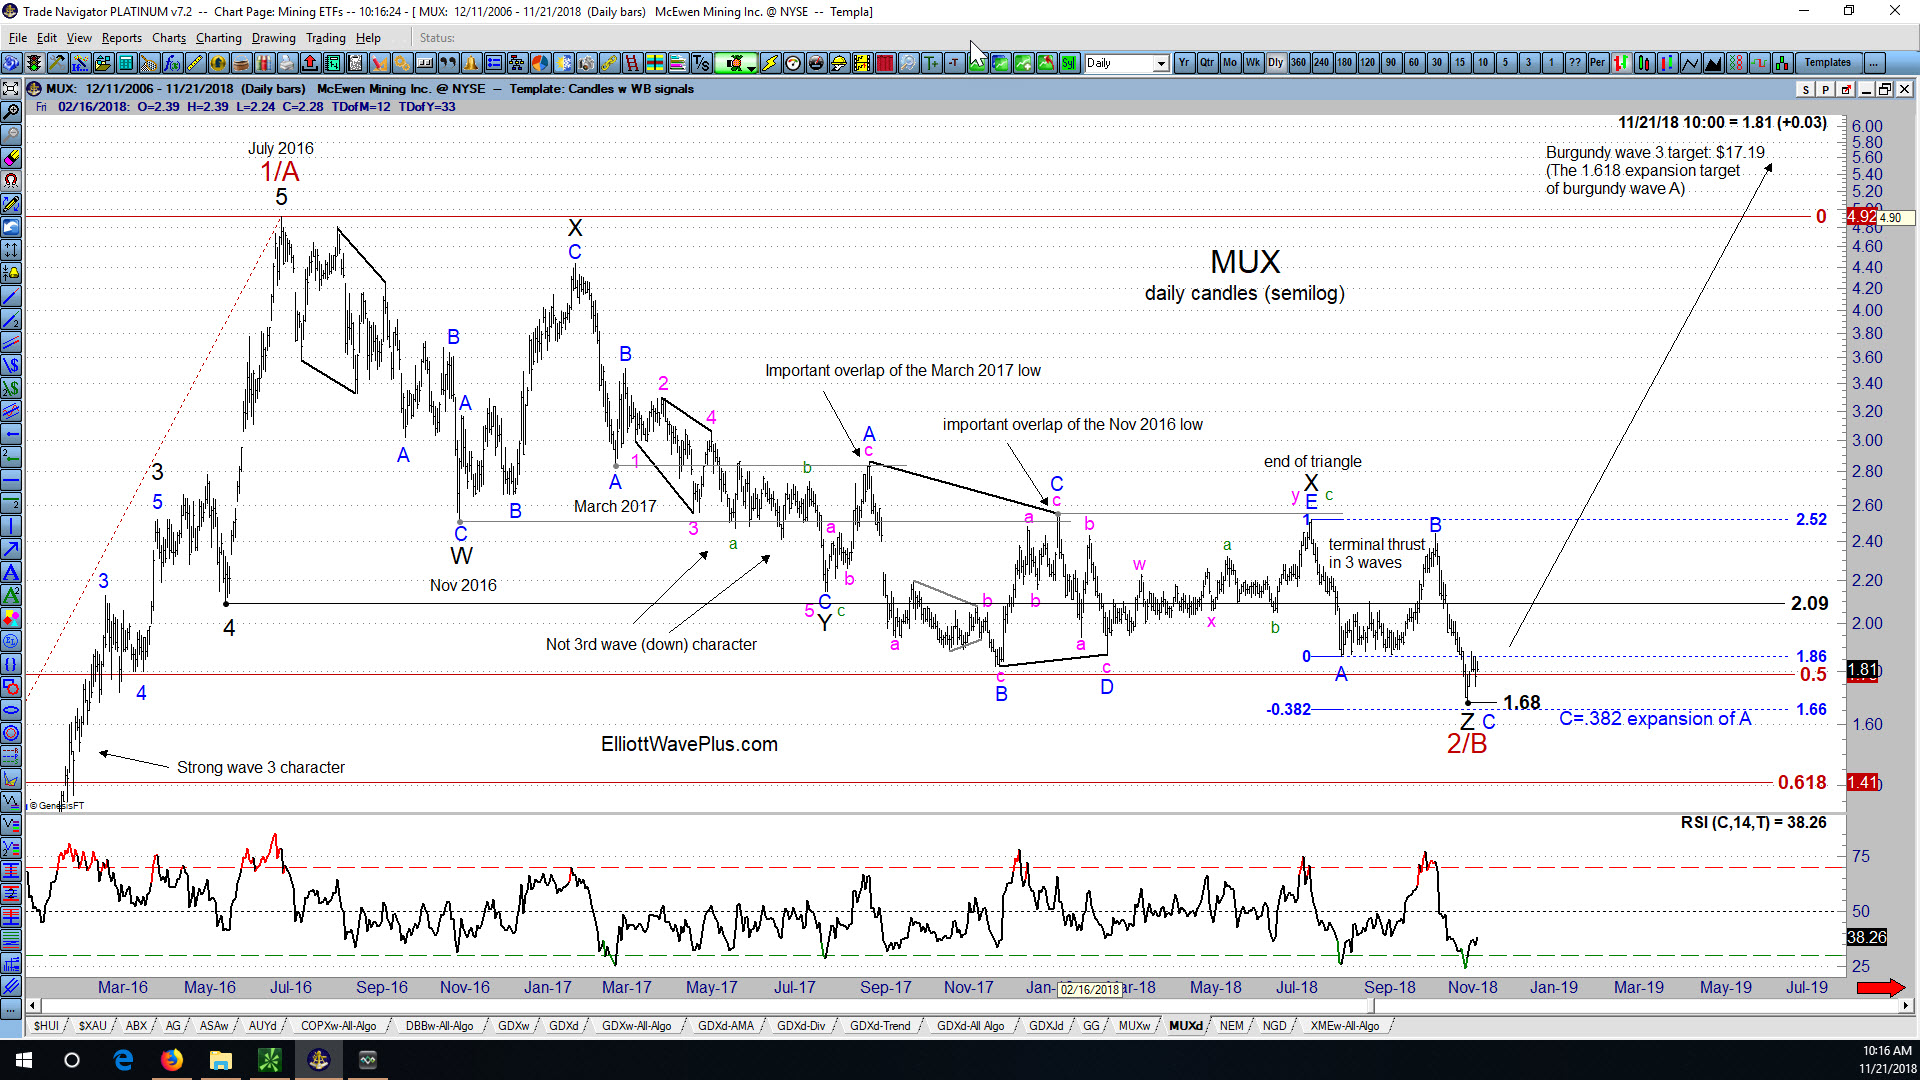
After my recent post on First Majestic Silver Corp. (AG), I’ve received a number of requests for my current wave count on McEwen Mining Inc. (MUX), another highly regarded stock in the precious metals mining sector.