Accurate Predictive Technical Analysis
Elliott Wave Plus continues its hot streak when it comes to technical analysis and future roadmaps on multiple stocks and sectors.
All About our Improved Nightly “Sentiment Conditions” Screenshots – from Elliott Wave Plus
It’s time for the Elliott Wave Plus Quarterly Premium Plan Webinar! Our Premium Plan is best known for supplying automated trade signals on about twenty different trade-able instruments to subscribers on a nightly basis. However, our longtime Premium Plan subscribers are telling us that our new, improved nightly “Sentiment Conditions” screenshots are easily worth the price of the subscription alone. See for yourself! We’ll spend most of the time in this online seminar revealing all aspects of our new improved Sentiment Conditions nightly screenshots. We’ll show how they can help subscribers become better informed about Commercials vs. Retail sentiment positioning, and how that knowledge can be extremely valuable when making trading decisions. Time will be allotted for Q&A.
Are Interest Rates Topping? Has Inflation Peaked?
The following video clip from our April 10, 2022 Weekly Counts Webinar provide timely food for thought on those two questions. Possible conclusions are based on Elliott wave theory and its associated Fibonacci price targets, multi-decades trendlines (on semilog charts), and current sentiment conditions.
Rising Interest Rates and Inflation are all over the news. Conventional expectations of the directional market reactions to news have been consistently wrong. Investors are confused and worried. It’s time to get technical.
Technical analysis eliminates the worry and confusion. It ignores mainstream financial media, and their ridiculous, news-based explanations of why the market moves up and down. Elliott Wave theory, Cycle analysis and Sentiment Conditions are more important to traders and investors now than ever before.
The attached video clip was recorded on Sunday, April 12, and was a small portion of Sid’s Weekly Counts Webinar for ElliottWavePlus.com subscribers (Pro Plan and up).
In the video, Sid Norris examines TNX (bond yields), and TIP (Treasury Inflation Protection bonds). Are rates going to continue to skyrocket unabated? Is the aggressive inflationary period over?
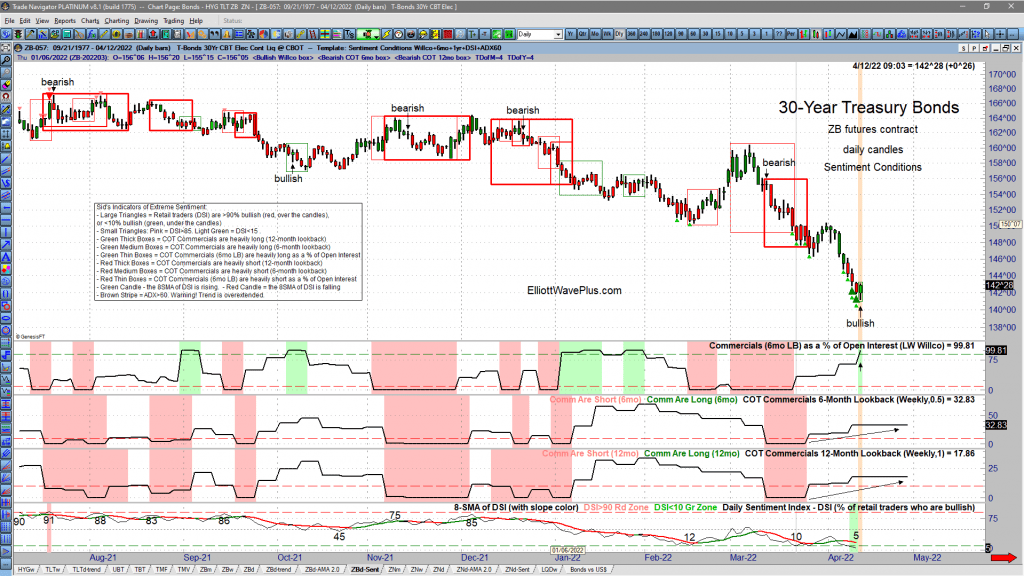
Additional evidence of Sentiment extremes in bonds were presented later in the webinar. Here are current screenshots of current Sentiment Conditions in the ZB contract (30yr bonds), the ZN contract (10yr bonds), and the Japanese Yen, which is historically highly correlated with bonds. These screenshots show that Commercials are expecting rates to top about now (and bonds bottom), while retail traders, who are almost always wrongly positioned at major trend changes, think that rates will continue to aggressively rise. Premium Plan subscribers receive Sentiment Conditions screenshots on many tradable items nightly.
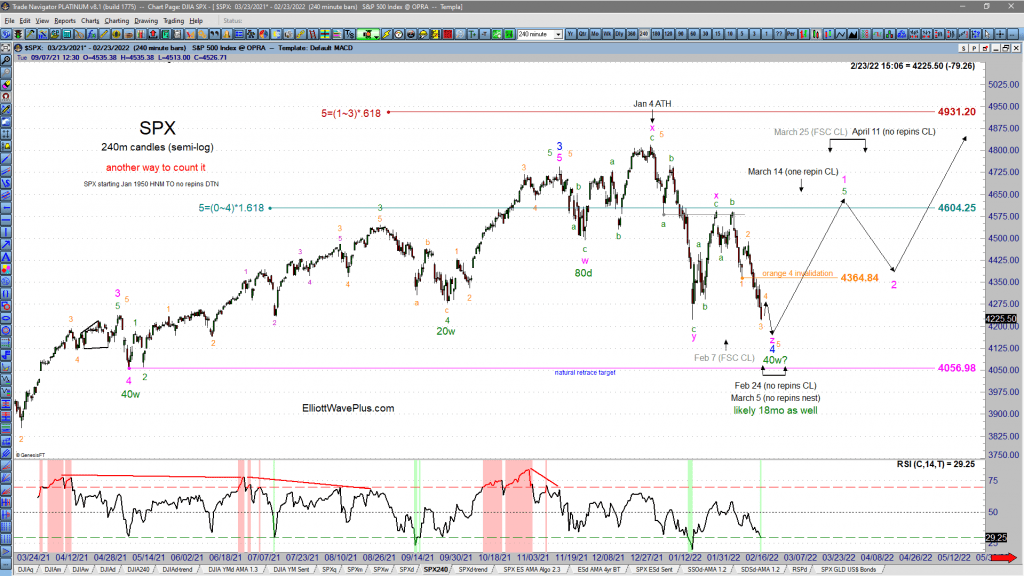
Every Wednesday and Sunday, we provide EWP Screenshots to subscribers (Basic Plan and up) on over two dozen popular trading instruments. The following are the last nine of those for the S&P-500, starting Feb 23, 2022, the day before the first shots were fired in the Russia – Ukraine war:
How Accurate has Elliott Wave Plus been on the S&P-500 recently?
How accurate has Elliot Wave Plus been on the S&P-500 Recently?
Here are our nine most recent EWP Screenshots of Sid’s predictive roadmaps for the S&P-500
Every Wednesday and Sunday, we provide EWP Screenshots to subscribers (Basic Plan and up) on over two dozen popular trading instruments. The following are the last nine of those for the S&P-500, starting Feb 23, 2022, the day before the first shots were fired in the Russia – Ukraine war:
Quarterly Premium Plan Webinar – January 25, 2022
It’s the first quarter of 2022, which means you’re in luck! The quarterly premium-plan webinar is now available for everyone to watch! If you’re new to Elliott Wave Plus, this is a chance for everyone to view an in-depth webinar where Sid goes over everything our premium plan subscribers get on a nightly basis! Every 3 months, Elliott Wave Plus reoptimizes it’s proprietary algos to the most current 3-year backtest results. In this blog, you will see all of the items covered on the nightly algo report, and which items have had the best results. Spoiler alert, the S&P-500 equivalent (SPX ES) had some amazing results! There were plenty of interesting topics discussed during the live webinar, so we encourage you to watch the entire video. Also, Sid has a special promotion for anyone interested in his most recent 4+ HOUR weekly counts webinar, where he goes over all of his Elliott Wave counts and associated Fibonacci price targets, for many of the world’s major stock markets, commodities, currencies, and bonds. Hurst Cycle analysis is also considered on virtually all items.
The Premium Plan consists of:
Nightly screenshots on over 20 trading instruments (stock index futures, commodities, currencies, bonds, etc.), showing the most recent momentum buy/sell signals, change stop to trailing indicators, and/or exit trade suggestions. Please visit ElliottWavePlus.com to see the full list of items covered.
Sentiment positioning on all items that contain sentiment data.
A nightly summary report including algo signals, sentiment conditions, Sid’s Elliott wave roadmap, and Hurst Cycle analysis on twenty items.
A nightly email letting subscribers know that today’s signals are available to view and download.
You’ll also be able to download a sortable excel spreadsheet showing the most recent 3-year backtest results. This sortable chart shows everything!
More Profitable Algo Trade Signals – KBE
Elliott Wave + Hurst had been projecting upward movement ever since the December 20th low. See how our algo caught this move to the upside.
Dow Jones Industrial Average | Comprehensive Technical Analysis
Dow Jones Industrial Average – Comprehensive Technical Analysis
Today’s video post is an excerpt of our January 2, 2022 weekly Counts webinar for Pro and Premium Plan subscribers at ElliottWavePlus.com. This excerpt consists of Sid’s highly detailed coverage of the Dow Jones Industrial Average. Sid starts by showing a cluster of several long-term Fibonacci targets in the 41-44K range on the Dow.
Sid explains that all this market needs to produce that grand Supercycle wave 3 top is a completed 5-wave structure up from the March 2020 low into that long-term target range. At this juncture, it appears that a 5-wave non-overlapping impulse is well underway from that March 2020 low. Hurst cycle analysis is current projecting that a major top will occur in the Dow in approximately late-May 2022. The Hurst projected top on the highly correlated S&P-500 is a little later, in late-Sept 2022.
GDX Miners Call 2021
GDX miners coverage 2021. In mid-November of 2021, there was a flood of articles being published around the internet that were extremely bullish gold, silver and the precious metals mining stocks. We know that at the time, there were also numerous self-professed Elliott Wave gurus preferring bullish wave counts. Sid’s use of Elliott Wave and Hurst allowed him to project an accurate GDX roadmap for subscribers.The key to our GDX roadmap was the expectation of a 20-week Hurst cycle PEAK in mid-November. Just as the masses were screaming “GOLD BREAKOUT!”, we were expecting a reversal.Check out the video, which is a great example of Sid’s typical weekly “counts” webinar coverage. Keep in mind, this is coverage over one specific item. Sid goes into detailed analysis on dozens of items every single week.
XLE Call
Then, more recently, during his August 22, 2021 weekend “Counts” webinar, Sid suggested that the correction since March in XLE had likely ended, and that large-cap oil companies should rally once again for several months, this time out of a larger 18-month Hurst cycle trough. As of today, XLE is up 31.61% from its August 19, 2021 low.
The Outcome
To put this into perspective, had subscribers bought $10,000 worth of XLE at the open on November 2 ($29.11), and closed that position upon the first appearance of a deeply overbought pink exhaustion stripe on our daily charts (at $52.20 open on March 10, 2021), that 10K would have turned into $17,932, a profit of $7,932. Additionally, had subscribers bought $10,000 worth of XLE at the opening price of $47.00 on August 23, and held until the first pink exhaustion stripe occurred, taking profit at $57.62 on October 22, that would have turned the $10K investment into $12,260, an additional profit of $2,260. Total profit by these two example trades? $10,192. Not too shabby!
Our question for you is, if you aren’t a current subscriber, why not?
The Premium Plan consists of:
Nightly screenshots on over 20 trading instruments (stock index futures, commodities, currencies, bonds, etc.), showing the most recent momentum buy/sell signals, change stop to trailing indicators, and/or exit trade suggestions. Please visit ElliottWavePlus.com to see the full list of items covered.
Sentiment positioning on all items that contain sentiment data.
A nightly summary report including algo signals, sentiment conditions, Sid’s Elliott wave roadmap, and Hurst Cycle analysis on twenty items.
A nightly email letting subscribers know that today’s signals are available to view and download.
You’ll also be able to download a sortable excel spreadsheet showing the most recent 3-year backtest results. This sortable chart shows everything!
XLE Precision Timing 2021

As a reminder, during his November 1, 2020 weekend “Counts” webinar for Pro and Premium Plan subscribers, Sid Norris of ElliottWavePlus.com suggested that the large-cap Oil companies ETF: XLE would rally big for several months out of a 40-week cycle trough. XLE went on to rally from 101.52% (from 26.98 to 54.37) through March 11, 2022. See our previous YouTube video showing Sid’s call here.
XLE Call
Then, more recently, during his August 22, 2021 weekend “Counts” webinar, Sid suggested that the correction since March in XLE had likely ended, and that large-cap oil companies should rally once again for several months, this time out of a larger 18-month Hurst cycle trough. As of today, XLE is up 31.61% from its August 19, 2021 low.
The Outcome
To put this into perspective, had subscribers bought $10,000 worth of XLE at the open on November 2 ($29.11), and closed that position upon the first appearance of a deeply overbought pink exhaustion stripe on our daily charts (at $52.20 open on March 10, 2021), that 10K would have turned into $17,932, a profit of $7,932. Additionally, had subscribers bought $10,000 worth of XLE at the opening price of $47.00 on August 23, and held until the first pink exhaustion stripe occurred, taking profit at $57.62 on October 22, that would have turned the $10K investment into $12,260, an additional profit of $2,260. Total profit by these two example trades? $10,192. Not too shabby!
Our question for you is, if you aren’t a current subscriber, why not?
The Premium Plan consists of:
Nightly screenshots on over 20 trading instruments (stock index futures, commodities, currencies, bonds, etc.), showing the most recent momentum buy/sell signals, change stop to trailing indicators, and/or exit trade suggestions. Please visit ElliottWavePlus.com to see the full list of items covered.
Sentiment positioning on all items that contain sentiment data.
A nightly summary report including algo signals, sentiment conditions, Sid’s Elliott wave roadmap, and Hurst Cycle analysis on twenty items.
A nightly email letting subscribers know that today’s signals are available to view and download.
You’ll also be able to download a sortable excel spreadsheet showing the most recent 3-year backtest results. This sortable chart shows everything!
The Recording of the Elliott Wave Plus Quarterly Premium Plan Webinar – October 19, 2021

Another quarter has gone by, which means it’s time for Elliott Wave Plus to reoptimize our proprietary algos to the most current 3-year backtest results. In this blog, you will see the everything our Premium Plan subscribers have access to on a nightly basis.
The Premium Plan consists of:
Nightly screenshots on over 20 trading instruments (stock index futures, commodities, currencies, bonds, etc.), showing the most recent momentum buy/sell signals, change stop to trailing indicators, and/or exit trade suggestions. Please visit ElliottWavePlus.com to see the full list of items covered.
Sentiment positioning on all items that contain sentiment data.
A nightly summary report including algo signals, sentiment conditions, Sid’s Elliott wave roadmap, and Hurst Cycle analysis on twenty items.
A nightly email letting subscribers know that today’s signals are available to view and download.
You’ll also be able to download a sortable excel spreadsheet showing the most recent 3-year backtest results. This sortable chart shows everything!

