Gold Mining Stocks – GDX Traded with Precision Timing

On March 28, 2021, Sid published the above chart of GDX for Elliott Wave Plus Basic Plan, Pro Plan, and Premium Plan subscribers:
Sid’s roadmap had GDX ready to bottom in early April, rally through late May, and then pull back sharply into a large Hurst cycle trough due in mid-August. His late-March 2021 main Elliott wave count predicted that the correction that had been underway in GDX since the early August 2020 high would eventually unfold as a WXYXZ triple zig-zag, likely ending in mid-August 2021, in harmony with the Hurst cycle analysis at the time.
The chart below is a current GDX weekly (through Sept 13, 2021):
This has been our challenge at Elliott Wave Plus, and we have alerted subscribers to several buying opportunities in undervalued sectors on the verge of ripping higher over the past year. We have posted YouTube videos of a couple of these timely alerts over the past year.
The first was our call to buy XLE (the large cap oil companies) in late October 2020. (See the post and video here). XLE more than doubled over the following 4.5 months. At the time that we made that call, famous talking heads on financial propaganda TV were vehemently recommending avoiding the sector. The second was our call to buy stocks in the shipping sector in early November 2020. (See the post and video on the shipping sector here.) Many, many stocks in that sector have more than doubled since then as well. In both examples, the sectors were at exceptionally low junctures after being beaten down for an extended period, and almost no one was talking about them.
In this post, we will show you another sector buying opportunity that we pointed out to subscribers in late March of this year. GDX (the Gold Miners ETF) has been up as much as 16+% so far since our mid-week (March 31) EWP ScreenShot (for Basic Plan and up subscribers) suggested an imminent turn to the upside. That suggestion that GDX would rally came after the precious metals sector endured seven long months of downside chop. Many of the companies in this recently neglected sector have been nicely profitable all through that multi-quarter correction, so bargain valuations have been easier to find here than in most other sectors.
The question is, does this rally have legs, or is it already done? There are many technical aspects we are actively looking at for clues, including a potential bullish 1-2-1-2 wave count from the early-March low, combined with the expectation of future peak and trough dates based on Hurst cycle analysis. We will keep our subscribers aware of our projected future roadmaps on GDX in addition to many tradable items with EWP ScreenShots of our analysis every Sunday and Wednesday (Basic Plan), as well a multi-hour weekly Sunday video (Pro Plan), excerpts of which were used to produce the YouTube video featured in this post.
Also shown in the attached video is a potential trade signal and associated multi-indicator setup produced by our proprietary momentum algo on GDX. Our Premium Plan provides screenshots and automated momentum trade signals on twenty popular items every night. Many of our subscribers use these nightly signals as confirmation of our proprietary analysis based on a combination of Elliott wave and its associated Fibonacci price targets, as well as Hurst cycle analysis.
Thrift Savings Plan TSP
Thrift Savings Plan | TSP Charts. Elliott Wave Plus is now providing weekly coverage on TSP funds (Thrift Savings Plan). Investing in TSP funds doesn’t have to be passive. Being aware of each fund’s current condition is critical when trying to decide where to invest. We have started charting the five core funds offered in the Thrift Savings Plan and are including two bonus charts each week to help the TSP participants have a broader picture of the overall market. Every week, Elliott Wave Plus will post these charts to the website under the current Trend Plan subscription. Subscribers will receive everything our Trend Plan has to offer, but will also receive the following:VOO – Vanguard S&P-500 VXF – Extended Market Index (small & midsize stocks)VEA – Markets around the globeBND – Total Bond Market VGSH – Short-Term Treasury
The Premium Plan consists of:
Nightly screenshots on over 20 trading instruments (stock index futures, commodities, currencies, bonds, etc.), showing the most recent momentum buy/sell signals, change stop to trailing indicators, and/or exit trade suggestions. Please visit ElliottWavePlus.com to see the full list of items covered.
Sentiment positioning on all items that contain sentiment data.
A nightly summary report including algo signals, sentiment conditions, Sid’s Elliott wave roadmap, and Hurst Cycle analysis on twenty items.
A nightly email letting subscribers know that today’s signals are available to view and download.
You’ll also be able to download a sortable excel spreadsheet showing the most recent 3-year backtest results. This sortable chart shows everything!
Elliott Wave Plus Premium Plan Algos

Another quarter has gone by, which means it’s time for Elliott Wave Plus to reoptimize our proprietary algos to the most current 3-year backtest results. In this blog, you will see the everything our Premium Plan subscribers have access to on a nightly basis.
The Premium Plan consists of:
Nightly screenshots on over 20 trading instruments (stock index futures, commodities, currencies, bonds, etc.), showing the most recent momentum buy/sell signals, change stop to trailing indicators, and/or exit trade suggestions. Please visit ElliottWavePlus.com to see the full list of items covered.
Sentiment positioning on all items that contain sentiment data.
A nightly summary report including algo signals, sentiment conditions, Sid’s Elliott wave roadmap, and Hurst Cycle analysis on twenty items.
A nightly email letting subscribers know that today’s signals are available to view and download.
You’ll also be able to download a sortable excel spreadsheet showing the most recent 3-year backtest results. This sortable chart shows everything!
Inside Look at our Automated Trade Signals
Time flies! We just crossed over into the second quarter of 2021, and that means we just completed our quarterly updates to our automated momentum algos. Moving forward, the nightly trade signals (produced on all twenty three covered items) will be based on updated backtesting and optimization, to the last three years of data. Premium Plan subscribers receive nightly algo screenshots on all 23 items, and a summary PDF showing the latest algo signals (buy & sell), trade management (stop, trailing stop & exits), commercials vs. retail sentiment positioning, Elliott Wave count, and Hurst Cycle analysis. Visit ElliottWavePlus.com to see the items covered in the Premium Plan, or see for yourself with our sortable Excel spreadsheet.Sortable Excel SpreadsheetBelow is a link to our downloadable spreadsheet, which includes the current 3-year backtest results on all items covered in the Premium Plan at Elliott Wave Plus. Within the table, you can sort by ROI, account size required, maximum closed-out drawdown, winning percentage, net profit, etc. Download and play with the spreadsheet using the link below.April 2021 sortable excel spreadsheet.Algo Signals – Our 3 year backtest resultsAs always, Elliott Wave Plus held a quarterly webinar explaining our propriety automated trading system, and how subscribers can best utilize our services. During the webinar, Sid goes into detail about the most successfully traded items over the past 3 years, as well as many aspects about how the algo was built and produces signals. Watch the video below, and please consider subscribing to our Youtube channel if you enjoy this free content.
Educational Course: Fibonacci Price Targets

Our friends at Elliott Wave International have allowed us to share some excellent education content with our subscribers! We are happy to share one of their most popular courses, for free. The 4-hour course teaches traders how to use Fibonacci levels to trade with more confidence. We use Fibonacci price targets extensively in our analysis to form our Elliott Wave counts, and we think you should, too.
The Fibonacci sequence provides the mathematical basis of the Elliott Wave Principle. The stock market’s price pattern builds fractally into similar patterns of increasing size. Familiarity with these patterns can prove incredibly useful to investors.
In the course, you’ll learn this and more:
How the Golden Ratio can help you see trading opportunities.
What the most important Fibonacci relationships are.
How Fibonacci relationships can help add confidence to your wave count.
How to project valuable time and price targets using Fibonacci dividers.
All About Our Premium Plan Automated Trade Signals

We’ve made significant improvements to our Premium Plan algorithmic trade signals. Our 3-year back-testing and re-optimization, and algo enhancements has been completed for Dec 1 2017 thru Dec 31 2020, and the results may surprise you! Every quarter, Elliott Wave Plus performs extensive re-coding and backtesting on all aspects of our proprietary algos. We then produce those backtest results via a sort-able excel spreadsheet, which is free and downloadable for everyone. A link to download the spreadsheet is provided below. Also, Sid just held an hour long webinar entitled “All About Our Premium Plan Automated Trade Signals”. This in-depth recording covers everything you need to know about our flagship subscription offering, and how to best utilize the nightly information provided to subscribers. This is a great tutorial for both new & long-time subscribers! Check out the video and download the spreadsheet.
Elliott Wave Plus | XLE Precision Timing
Elliott Wave Plus | XLE Precision Timing | A 55% gain in 29 trading days. For more technical analsysis visit ElliottWavePlus.com
S&P-500 – Almost 500% Return For The Year.
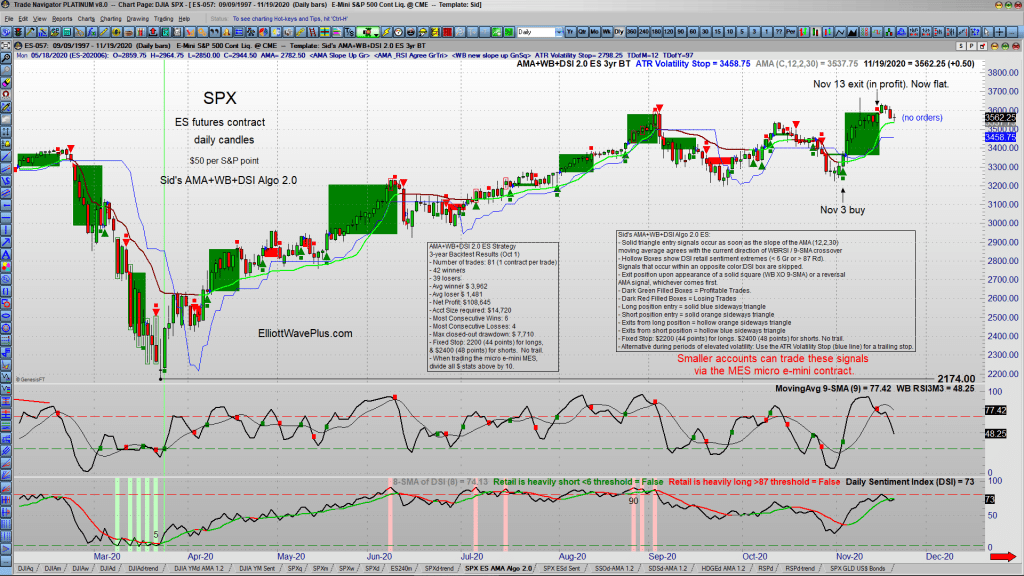
Trend Report. Elliott Wave Trading – Elliott Wave S&P-500 review. How our algo trade signals produced nearly 500% in gains for the year.
Trend Following vs Algo Trading
Every Elliott Wave Plus subscriber receives our trend following charts each night following the close of the U.S stock market. We believe that these trend charts are valuable trading tools, and everyone should be aware of them. But does that make it a perfect system? The short answer is…no.
We take a look at our Daily Trend Report charts in direct comparison to our Nightly Algo trade signals. They might look similar, but the Algo signals have one major advantage. You’ll see why in the video below, which is an excerpt of the previous week’s webinar. Premium Plan subscribers receive the Nightly Algo Report every evening, as well as weekly access to Sid’s Elliott Wave “counts” webinar, bi-weekly screenshots, and the Daily Trend Report.
Trading Using Elliott Wave – Technical Analysis on Baltic Dry Index – Shipping Sector
Elliott Wave Plus took a deeper look at Baltic Dry Index during the November 8, 2020 weekly-webinar. Pro Plan subscribers were pleased to see an immediate jump, specifically in the shipping sector just one day after the webinar. Check out the excerpt below. Be sure to subscribe for more in-depth technical analysis. Below is a list of items routinely covered by ElliottWavePlus.com. Check out our other resources on educational Elliott Wave trading.