Elliott Wave Presentation for Synergy Traders
Our unique approach is well worth consideration, especially if you’ve never experienced wave labeling and associated Fibonacci price targets that are derived in harmony with independent Hurst cycle analysis. Here’s more info about subscribing.
Elliott Wave Hub Bi-Annual Event

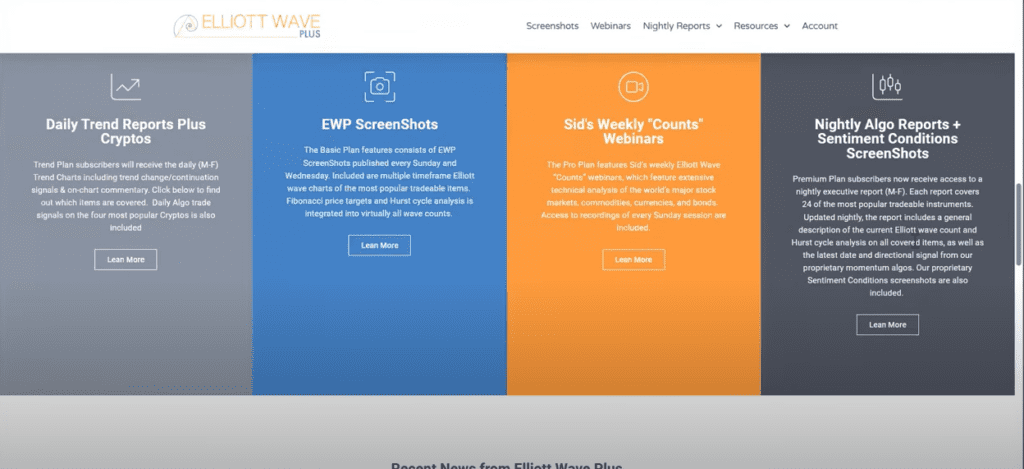
We offer four subscription levels. The Premium Plan includes everything we do including daily momentum algo trade signals on over twenty items, as well as daily screenshots of our proprietary Sentiment Conditions template. The Pro and Premium plans include future roadmaps based on a combination of Elliott Wave and Hurst Cycles, as well as a “live” weekly Counts webinar. The Basic Plan includes the Elliott wave + Hurst cycles screenshots only (twice-per-week), but no weekly webinar. The entry level Trend Plan offers daily trend analysis (but no Elliott Wave or Hurst) on many popular items, plus momentum algo signals on Cryptos. It DOES include Elliott Wave daily and weekly counts on Bitcoin.
EWP Premium Plan Webinar

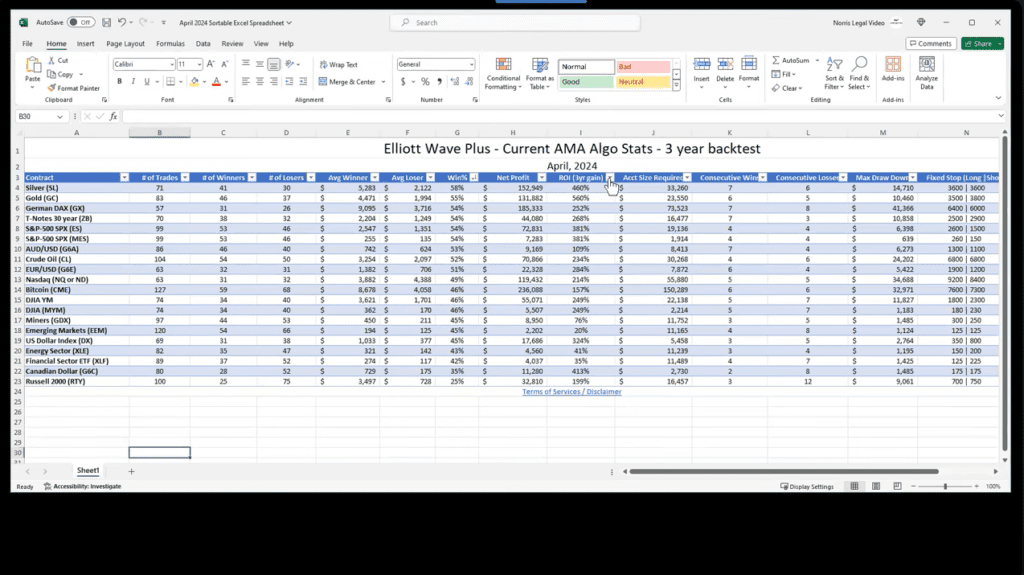
We have included our re-optimized AMA Algo results as always! Please use the download link below so you can view/sort the results as you see fit. We have included a special offer to any new subscribers as well. If you’re interested in subscribing to Elliott Wave Plus, we have conveniently provided you a link to our pricing page. Thank you for supporting us!
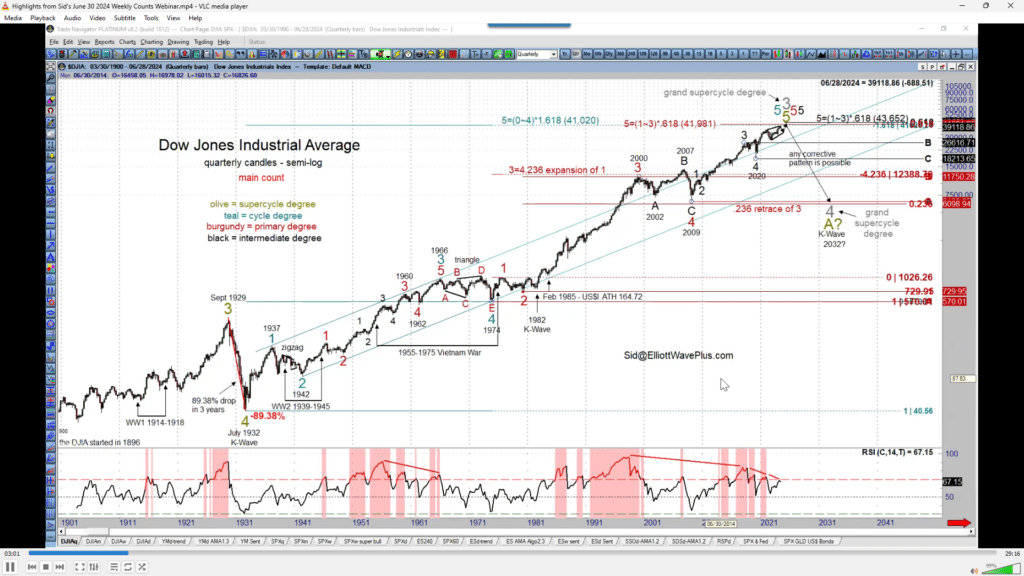
Highlights from Sid’s Weekly Counts Webinar

During Sid’s June 30, 2024 weekend webinar, Sid Norris of ElliottWavePlus.com showed what a bullish wave count would look like if the S&P-500 was in the process of carving out a 5-wave non-overlapping impulse starting from the March 2020 low. Spoiler Alert: The wave 3 up from that low has a wave target of 18,500 !!!
Elliott Wave Plus – Quarterly Premium Plan Webinar – April, 2024
The session gave very specific information about the design of our proprietary momentum algos, as well as our proprietary Sentiment Conditions screenshots. As always, several of our combined Elliott Wave / Hurst cycle analysis roadmaps on popular tradable instruments was revealed. Be sure to view and/or download the spreadsheet that shows the most recent backtest results on our optimized algo trading signals below.
Elliott Wave Hub Event
Another bi-annual Elliott Wave Hub Event is in the books, and Sid Norris was the first presenter of the day, February 13, 2024. During his presentation, Sid offered a glimpse of what we provide subscribers inside our four different levels of service. He also showed his current Elliott Wave counts and associated Fibonacci price targets on the Dow Jones Industrials. Transports, and Utilities, as well as the S&P-500, XLF financials, GDX gold miners, and a Hurst Cycle analysis of the US Dollar Index. The markets are at or near a protentional turning point! A special, limited time offer was also presented for new subscribers.
Quarterly Premium Plan Webinar – January, 2024
Premium Webinar July 2023. Included in tonight’s edition is Sid’s Elliott wave counts on many popular tradable items. Click the link below.
Dow Jones Industrial Average Call – October 29, 2023
Here’s a video clip of the October 29, 2023 webinar, where Sid predicted the 500 point up day in the Dow Jones Industrial Average.
Premium Plan Webinar Recording – October 10, 2023
Premium Webinar July 2023. Included in tonight’s edition is Sid’s Elliott wave counts on many popular tradable items. Click the link below.
Elliott Wave Plus – Premium Plan Webinar Recording – July 20, 2023
Premium Webinar July 2023. Included in tonight’s edition is Sid’s Elliott wave counts on many popular tradable items. Click the link below.