Elliott Wave Plus | XLE Precision Timing

Elliott Wave Plus | XLE Precision Timing | A 55% gain in 29 trading days. For more technical analsysis visit ElliottWavePlus.com
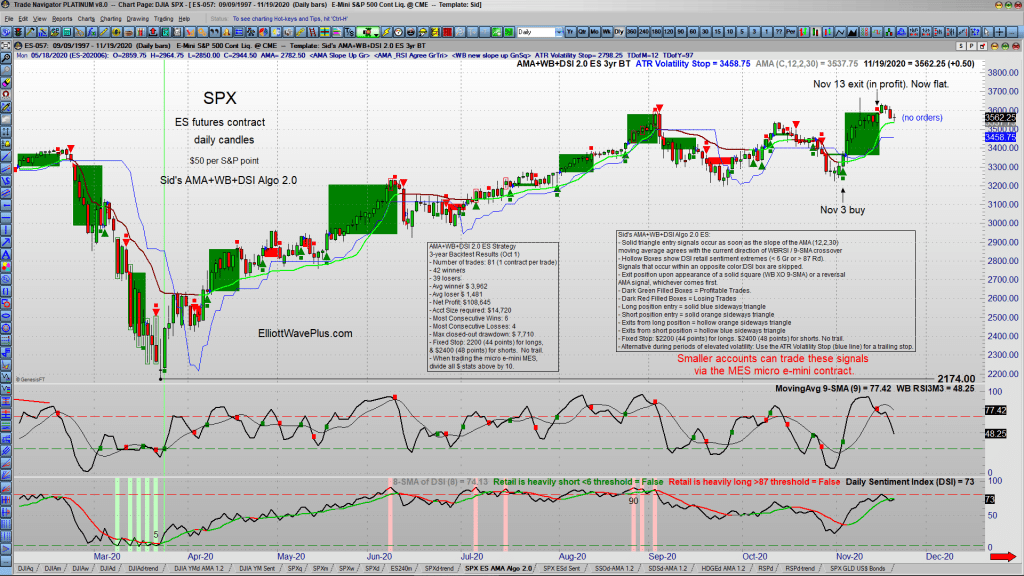
S&P-500 – Almost 500% Return For The Year.

Trend Report. Elliott Wave Trading – Elliott Wave S&P-500 review. How our algo trade signals produced nearly 500% in gains for the year.
Trend Following vs Algo Trading

Every Elliott Wave Plus subscriber receives our trend following charts each night following the close of the U.S stock market. We believe that these trend charts are valuable trading tools, and everyone should be aware of them. But does that make it a perfect system? The short answer is…no.
We take a look at our Daily Trend Report charts in direct comparison to our Nightly Algo trade signals. They might look similar, but the Algo signals have one major advantage. You’ll see why in the video below, which is an excerpt of the previous week’s webinar. Premium Plan subscribers receive the Nightly Algo Report every evening, as well as weekly access to Sid’s Elliott Wave “counts” webinar, bi-weekly screenshots, and the Daily Trend Report.
Why Use the Wave Principle?

In this video, Senior Tutorial Instructor Wayne Gorman uses real headlines, actual events and charts to provide a comprehensive look at what the financial media say drives the markets and why their “fundamentals” are usually wrong. And more importantly, you’ll learn why Elliott wave analysis is your best tool for forecasting the markets.
There’s an FOMC meeting and announcement next week. What’s the likely market reaction in silver?

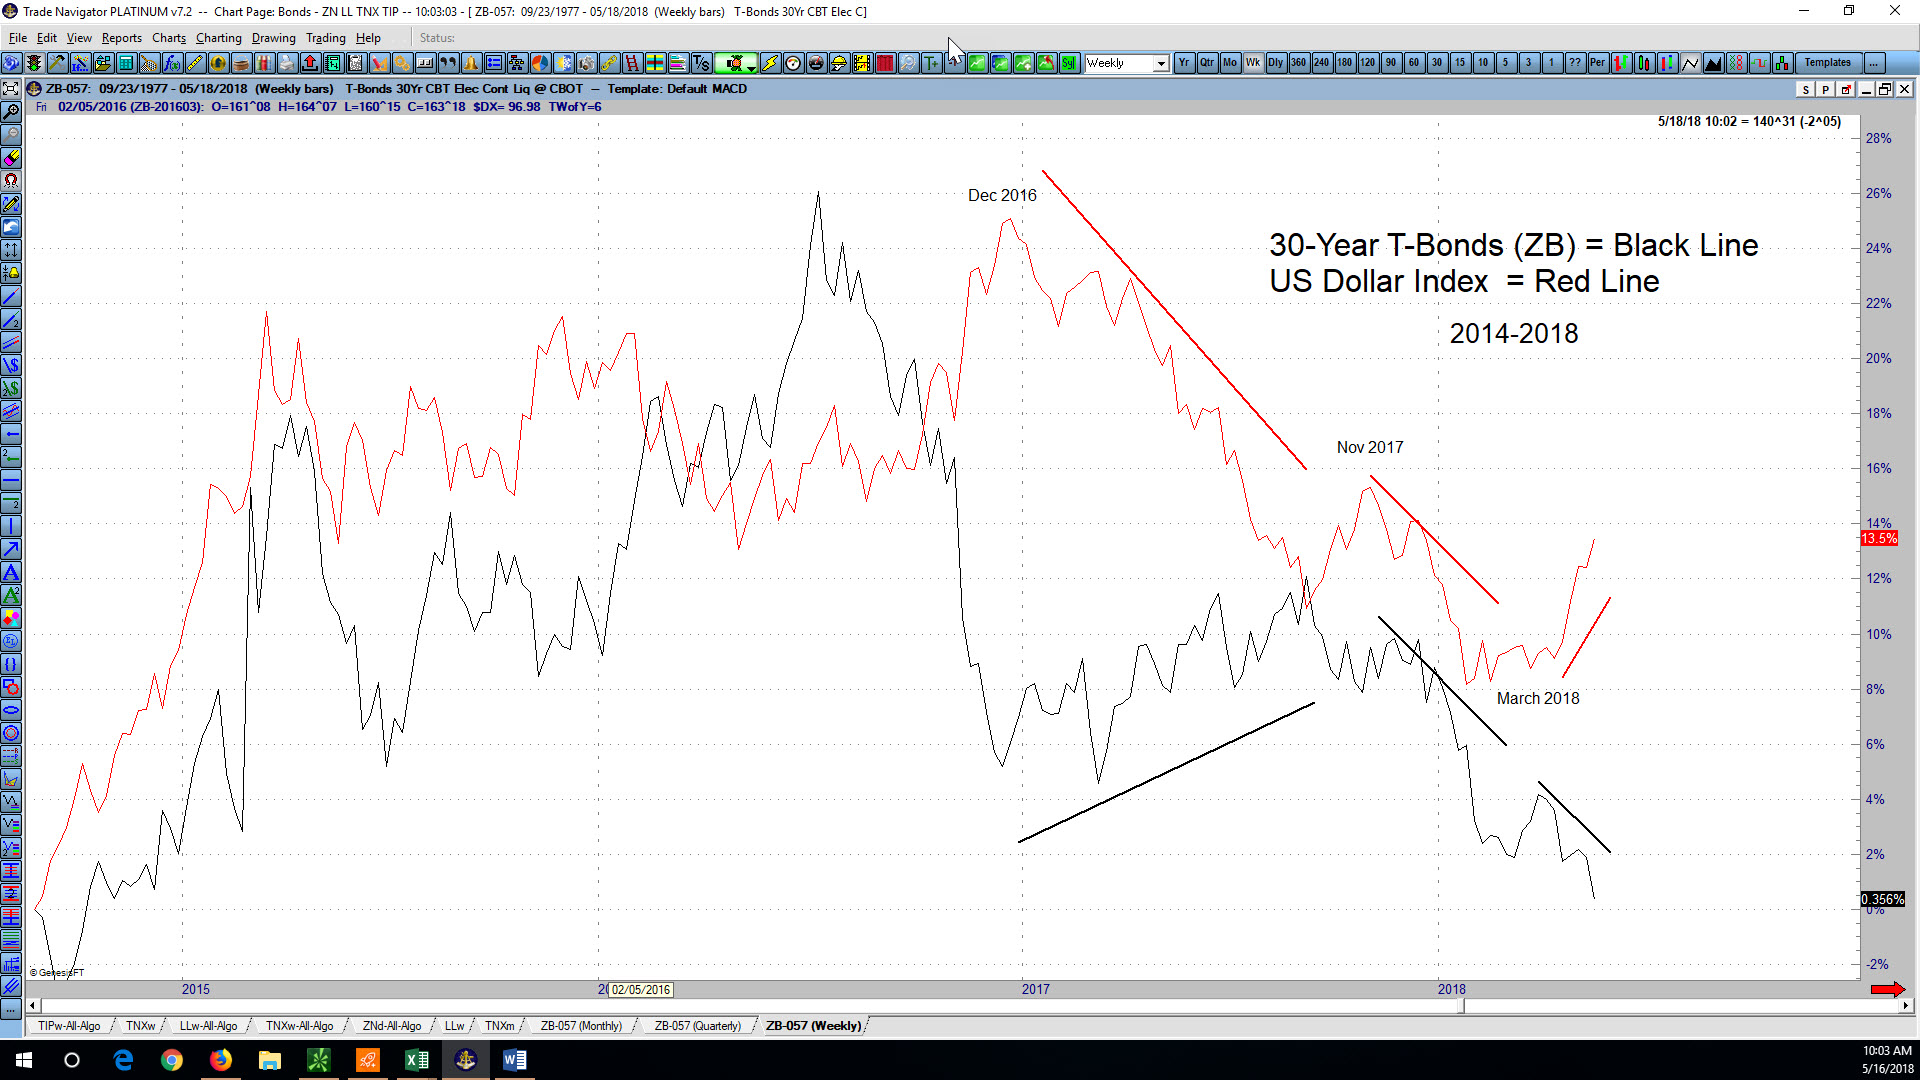
My work as a market technician is generally based on the premise that markets move based on technical aspects derived from prior price action. However, very large players with an agenda (ie: central banks around the globe) are actively involved in the markets. Can looking at both the technical and the influence of the FED provide greater insight into market forecasts? Let’s take a look.
10-Year Treasury Yields Have “Broken Out” to a New Multi-Year High. Will Yields Continue Higher?

Yesterday’s market jolt, according to the talking heads on financial propaganda TV was due to 10-year treasury yields “breaking out” above their Dec 2013 high. I’m sure this slight new high invalidated a few Elliott Wave counts, and “confirmed” a few others.
How I Eliminated Emotion and Directional Bias from my Elliott Wave Counts – A blog post by Sid Norris of ElliottWavePlus.com

I’ve been labeling charts using Elliott Wave theory for a very long time. I’ve also always tracked the Elliott Wave interpretations (wave counts) from several published wave counters over the years. Almost everyone familiar with Elliott Wave theory knows that . .
Elliott Wave Analysis of the S&P 500 SPX EX – the “Bullish ’til June” scenario – by Sid from ElliottWavePredictions.com
Elliott Wave Analysis of the S&P500 SPX – the “bullish ’til June” scenario – by Sid from ElliottWavePredictions.com. As always . . please click on the chart twice to enlarge. The push off yesterday’s mid-day low followed through aggressively today, and looks to have legs. So . . (trumpet blast) . . enter my new […]
