Elliott Wave and Hurst Cycles Event Presentation
How Our Method of Combining Elliott Wave and Hurst Cycle Analysis is Far Superior to Elliott Wave Theory when used in isolation.
Elliott Wave Presentation for Synergy Traders
Our unique approach is well worth consideration, especially if you’ve never experienced wave labeling and associated Fibonacci price targets that are derived in harmony with independent Hurst cycle analysis. Here’s more info about subscribing.
Elliott Wave Hub Bi-Annual Event

We offer four subscription levels. The Premium Plan includes everything we do including daily momentum algo trade signals on over twenty items, as well as daily screenshots of our proprietary Sentiment Conditions template. The Pro and Premium plans include future roadmaps based on a combination of Elliott Wave and Hurst Cycles, as well as a “live” weekly Counts webinar. The Basic Plan includes the Elliott wave + Hurst cycles screenshots only (twice-per-week), but no weekly webinar. The entry level Trend Plan offers daily trend analysis (but no Elliott Wave or Hurst) on many popular items, plus momentum algo signals on Cryptos. It DOES include Elliott Wave daily and weekly counts on Bitcoin.
Elliott Wave Hub Event
Another bi-annual Elliott Wave Hub Event is in the books, and Sid Norris was the first presenter of the day, February 13, 2024. During his presentation, Sid offered a glimpse of what we provide subscribers inside our four different levels of service. He also showed his current Elliott Wave counts and associated Fibonacci price targets on the Dow Jones Industrials. Transports, and Utilities, as well as the S&P-500, XLF financials, GDX gold miners, and a Hurst Cycle analysis of the US Dollar Index. The markets are at or near a protentional turning point! A special, limited time offer was also presented for new subscribers.
Elliott Wave Hub Presentation – June 27, 2023
During this presentation, Sid showed his current wave counts on the Dow Jones Industrial Average, the S&P-500, Bonds, and Gold.
Elliott Wave Hub Presentation
During this presentation, Sid showed his current wave counts on the Dow Jones Industrial Average, the S&P-500, Bonds, and Gold.
Why Our Trading System is Superior to Others

We avoid directional bias by utilizing a combination of dissimilar but robust technical analysis tools and have developed a mix of the specific tools most likely to provide timely trading setups.
The Stock Market is Entering 2023 at a Critical Juncture
The Stock Market Is Entering 2023 At A Critical Juncture
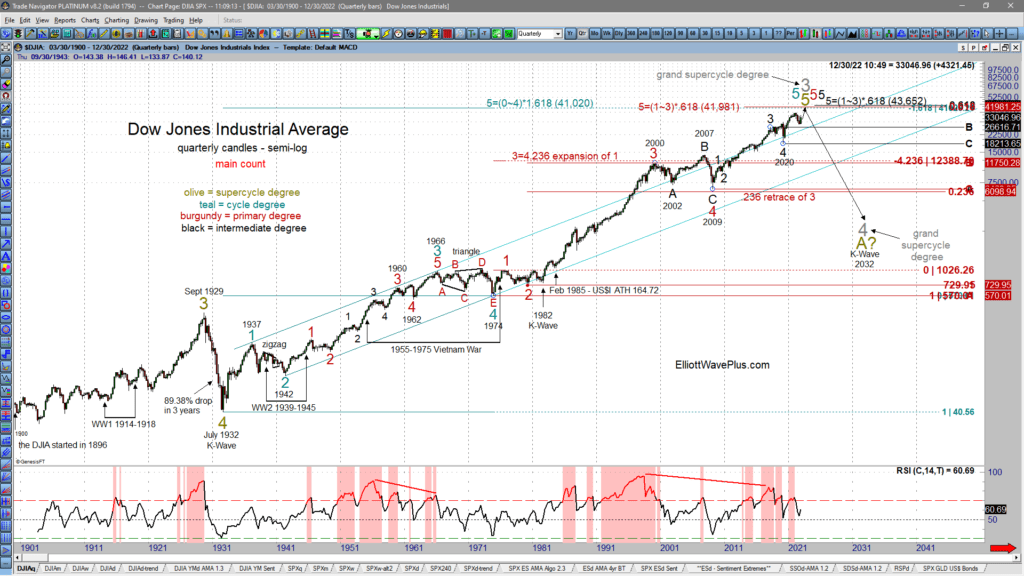
Summary
There is a cluster of three large-degree Fibonacci targets that suggest that the Dow Jones Industrial Average has not completed 5-waves up from the 1932, 1974 & 2009 lows yet.
The March 2020 low was an intermediate-degree (black) wave 4 low. There are two potential ways the market can finish a 5-wave structure up from that low.
Shorter-term, I’ve been tracking three potential wave counts for the S&P-500. The market could eliminate up to two of those counts during the first few weeks of the new year.
Our method of combining Elliott wave and its associated Fibonacci price targets, Hurst cycle analysis, sentiment extremes, momentum, volume signatures and more provide higher confidence trading forecasts than Elliott wave theory when used alone.
What’s Driving the Markets this Year?
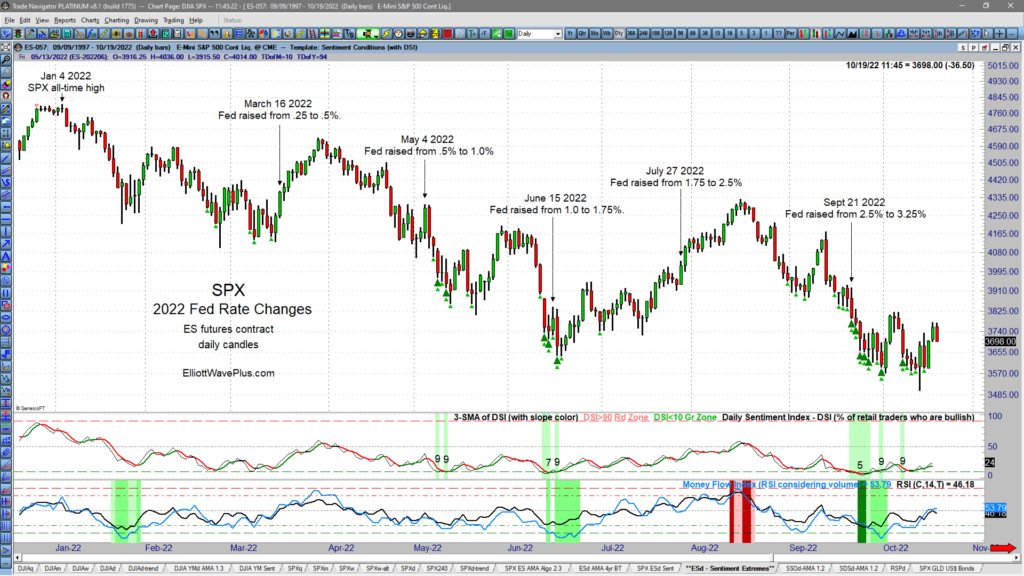
What’s been driving the markets this year? If your market research consists primarily of watching financial television channels, you’d swear that the Fed must be controlling all market movements like it was a puppet master! The vast majority of TV pundits will answer questions about where the market is going next with at least some mention of the Fed. Let’s look at all the Fed’s rate changes so far this year to see if they are producing consistent buy or sell signals for investors and traders.
How to Utilize Elliott Wave Plus
Welcome to the October 2022 Quarterly Premium Plan Webinar. These quarterly events are Elliott Wave Plus’s most anticipated events. Our current subscribers find these recording extremely useful, as do our free visitors at ElliottWavePlus.com. This video and blog will show how to best utilize our service offerings here at Elliott Wave Plus and will help new subscribers decide which subscription tier is right for them.

