Are Interest Rates Topping? Has Inflation Peaked?
The following video clip from our April 10, 2022 Weekly Counts Webinar provide timely food for thought on those two questions. Possible conclusions are based on Elliott wave theory and its associated Fibonacci price targets, multi-decades trendlines (on semilog charts), and current sentiment conditions.
Rising Interest Rates and Inflation are all over the news. Conventional expectations of the directional market reactions to news have been consistently wrong. Investors are confused and worried. It’s time to get technical.
Technical analysis eliminates the worry and confusion. It ignores mainstream financial media, and their ridiculous, news-based explanations of why the market moves up and down. Elliott Wave theory, Cycle analysis and Sentiment Conditions are more important to traders and investors now than ever before.
The attached video clip was recorded on Sunday, April 12, and was a small portion of Sid’s Weekly Counts Webinar for ElliottWavePlus.com subscribers (Pro Plan and up).
In the video, Sid Norris examines TNX (bond yields), and TIP (Treasury Inflation Protection bonds). Are rates going to continue to skyrocket unabated? Is the aggressive inflationary period over?
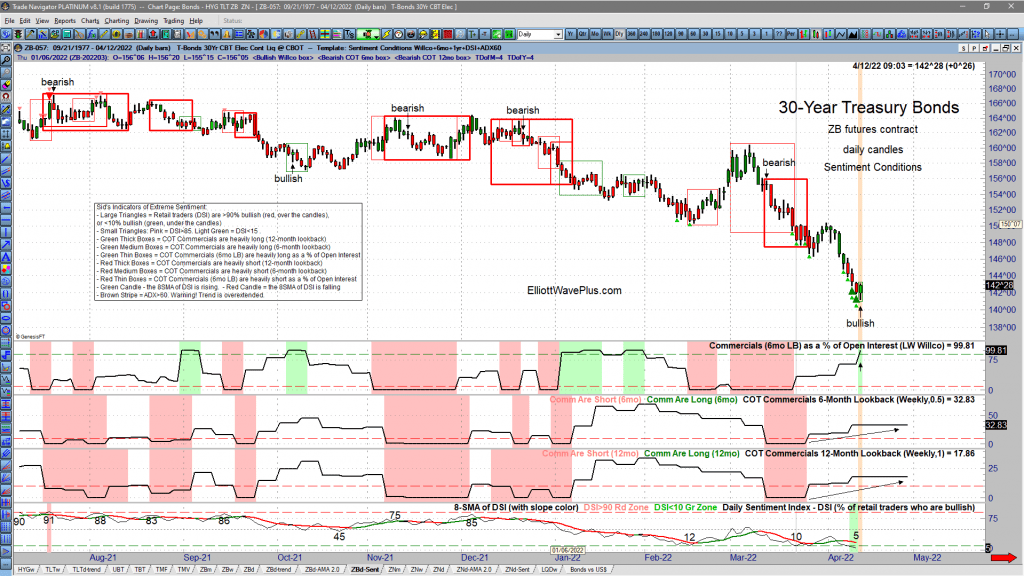
Additional evidence of Sentiment extremes in bonds were presented later in the webinar. Here are current screenshots of current Sentiment Conditions in the ZB contract (30yr bonds), the ZN contract (10yr bonds), and the Japanese Yen, which is historically highly correlated with bonds. These screenshots show that Commercials are expecting rates to top about now (and bonds bottom), while retail traders, who are almost always wrongly positioned at major trend changes, think that rates will continue to aggressively rise. Premium Plan subscribers receive Sentiment Conditions screenshots on many tradable items nightly.
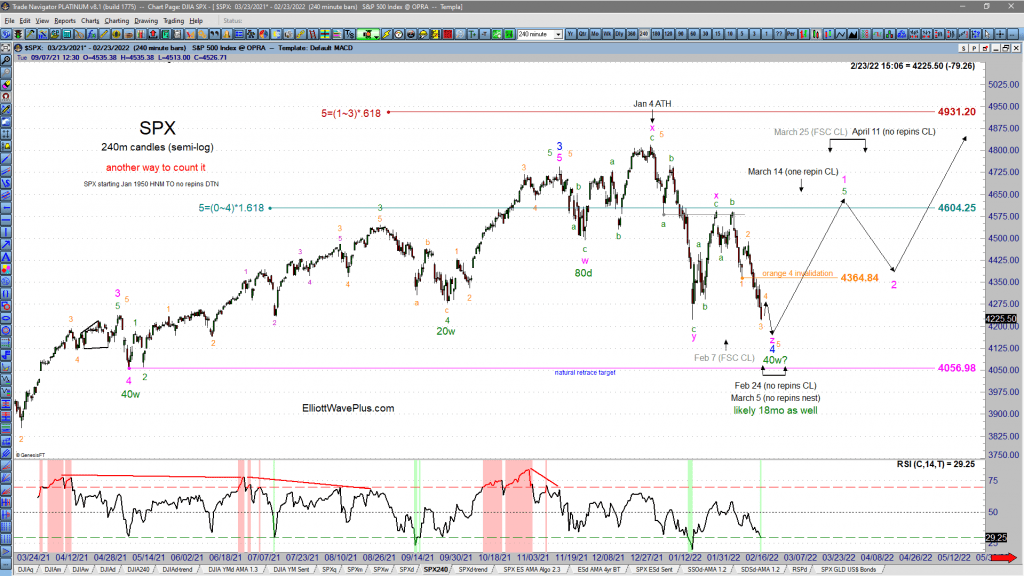
Every Wednesday and Sunday, we provide EWP Screenshots to subscribers (Basic Plan and up) on over two dozen popular trading instruments. The following are the last nine of those for the S&P-500, starting Feb 23, 2022, the day before the first shots were fired in the Russia – Ukraine war:
How Accurate has Elliott Wave Plus been on the S&P-500 recently?
How accurate has Elliot Wave Plus been on the S&P-500 Recently?
Here are our nine most recent EWP Screenshots of Sid’s predictive roadmaps for the S&P-500
Every Wednesday and Sunday, we provide EWP Screenshots to subscribers (Basic Plan and up) on over two dozen popular trading instruments. The following are the last nine of those for the S&P-500, starting Feb 23, 2022, the day before the first shots were fired in the Russia – Ukraine war:
Who Could Have Predicted This Huge Down Move In The Market?
On November 15, 2019, the S&P-500 reached 3120 for the first time ever. For the next 63 trading days, the S&P continued relentlessly higher, topping on Feb 19 at 3393. Just four days later, the S&P was back down to 3120, almost instantly erasing three full months of gains! Nobody could have seen that coming ahead of time, could they? We know of at least one person who did.
Have We Reached An Unsustainable Situation?

Gold & Bonds are typically correlated. As of this writing, that historic relationship appears to be intact. Compare that to Gold & the U.S dollar. Those two items typically move opposite (inverse) of each other. However, since mid-July 2019, they have generally been moving up and down together.
Bonds, which are the most popular alternative to stock ownership in the investment world, typically move opposite of the stock market. However, ever since the start of the new year (2020), stocks, bonds, gold and the US Dollar have all been rallying together. Is this a distortion that has developed because of mid-October 2019 Fed announcement of QE? Many think so. If so however, there was a delayed reaction of 2.5 months.
When the Stock Market Goes Down, Gold Goes Up. Right?

During the Jan 19 webinar, Sid showed an intermediate-term chart of Gold and the S&P-500 Index, one overlaid upon the other. The chart clearly showed that gold and the stock market don’t always move inversely, as many seem to believe. Sometimes the two items move opposite each other, but other times they generally move together, in positive correlation. For instance, since early October 2019, the two items have generally been moving to the upside together.
This video clip, taken from that January 19 weekly “Counts” webinar includes Sid’s discussion of the above myth, as well as his chart of Gold vs. the S&P. For those who believe that Gold will “save them” when the stock market crashes next, the video is worthy of consideration.
Are there potential trading profits to be made on both the upside and downside of the S&P as well as Gold? Absolutely. But the two items really should be analyzed and traded independently.
Bonus screenshot from the January 26 weekly webinar. Notice how highly correlated the S&P and the XAU (Gold & Silver Sector Index) have been since early October.
My Current Analysis of the S&P-500 by Sid Norris from ElliottWavePlus.com
From an Elliott Wave perspective, my top two wave counts are shown. The main count is that an incomplete expanding leading diagonal to the downside is underway starting at the September 21 all-time high. The alternate (shown with question marks) is that an intermediate degree (black) wave 5 to the upside commenced at the December 24 low.
Sid’s Sentiment Algo. How and Why it Works.
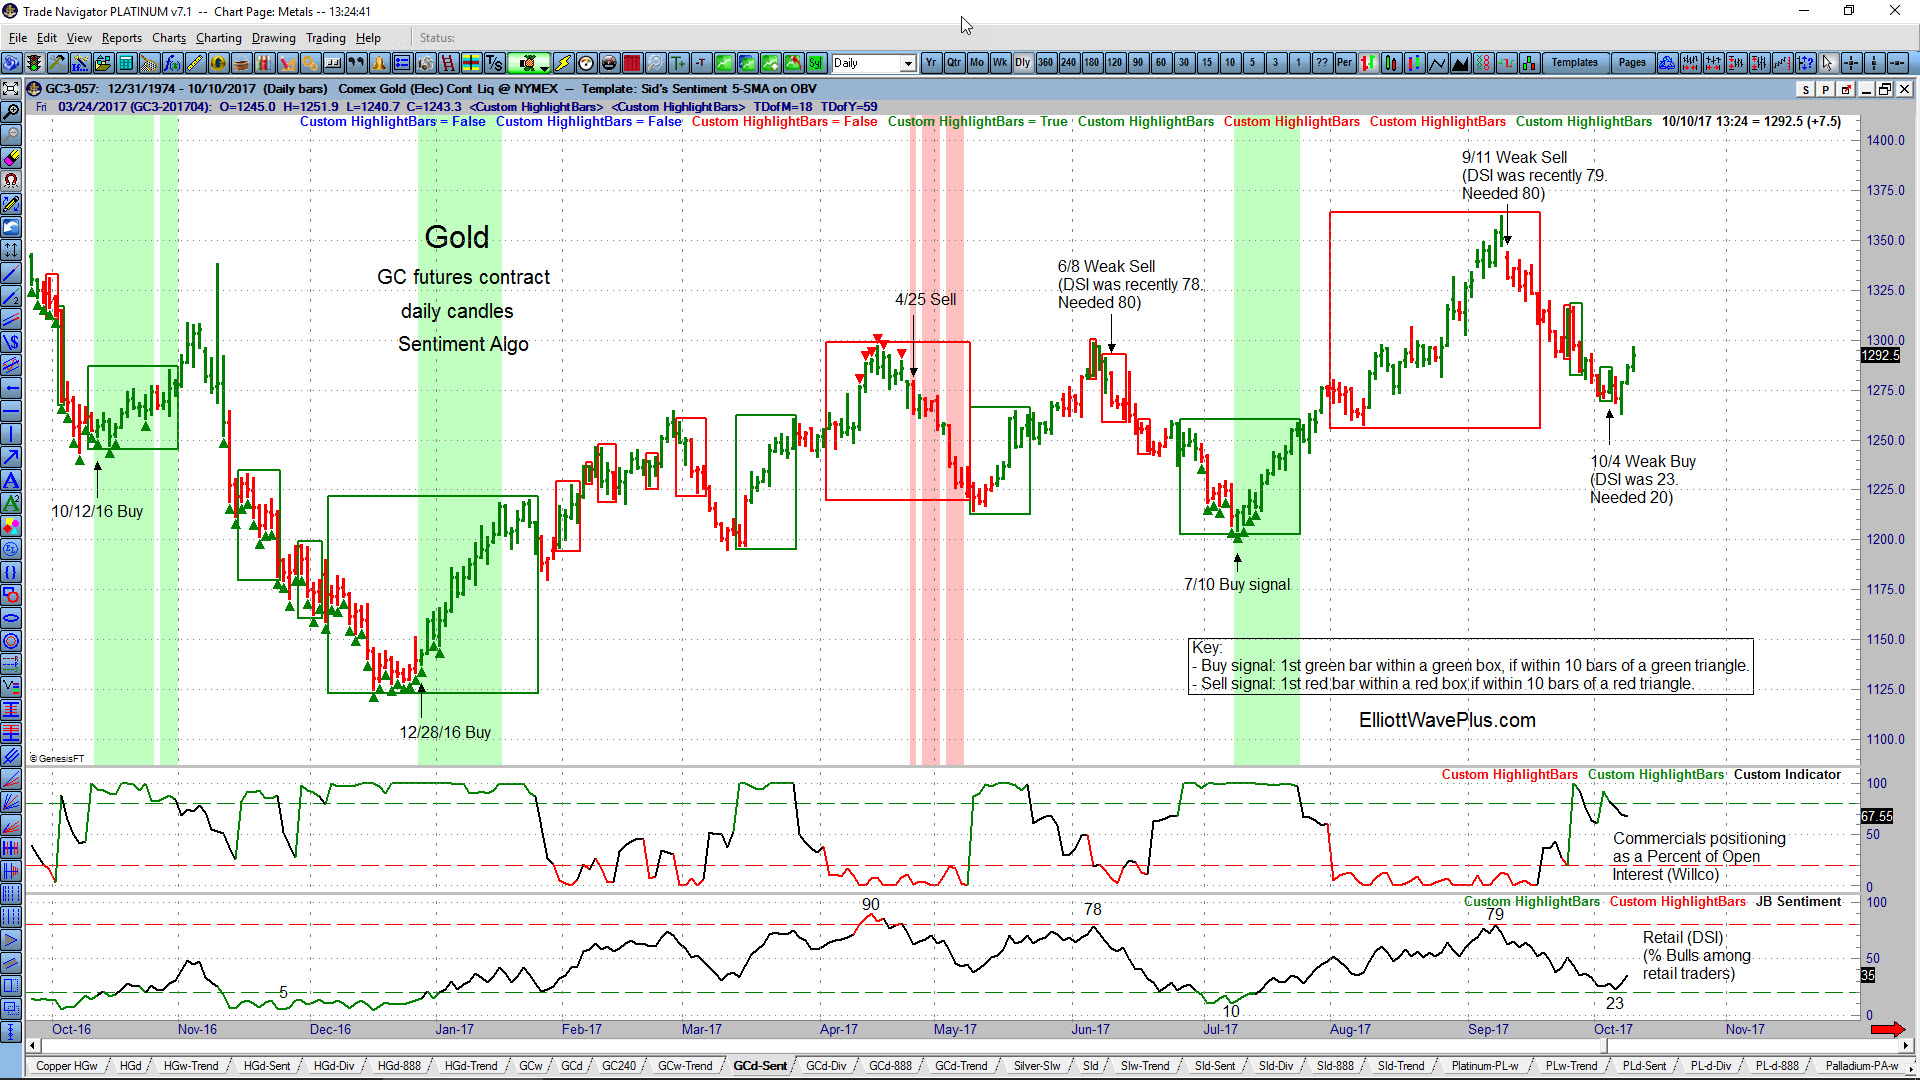
In the following video, Sid Norris of Elliott Wave Plus shows the latest revision of his Sentiment Algo, how it was constructed, and how well it has marked several trend changes in the S&P-500 and Gold over the past year.
Highlights from Sid’s January 10, 2016 “Counts” Webinar – from ElliottWavePredictions.com
Highlights from Sid’s January 10, 2016 “Counts” Webinar, featuring the Dow Jones Industrial Average and S&P-500 – from ElliottWavePredictions.com. A week ago, I posted highlights from the January 3 “Counts” webinar, indicating that I thought the week of Jan 4-8 would be a strong down week in the stock markets. As it turned out, the […]
Sid’s Combined Elliott Wave & Hurst Cycle Analysis of the S&P-500 (SPX) from his January 3, 2016 “Counts” Webinar – ElliottWavePredictions.com
Sid’s Combined Elliott Wave & Hurst Cycle Analysis of the S&P-500 (SPX) from his January 3, 2016 “Counts” Webinar – ElliottWavePredictions.com. The 5-minute video clip below is from my January 3, 2016 “Counts Webinar. Did your current subscription service predict strong downside continuation to new lows below the November and December lows in stocks this […]
Replay of the November 30 Hurst Cycles Webinar – Sid Norris, guest presenter
I had the distinct pleasure of appearing as the guest presenter in yesterday’s weekly Hurst cycles webinar. David Hickson, the creator of Sentient Trader software typically holds these free webinars every Monday and was kind enough to invite me to participate as guest presenter. During the webinar, I discuss why I consider October 2011 to […]