Have We Reached An Unsustainable Situation?

Gold & Bonds are typically correlated. As of this writing, that historic relationship appears to be intact. Compare that to Gold & the U.S dollar. Those two items typically move opposite (inverse) of each other. However, since mid-July 2019, they have generally been moving up and down together.
Bonds, which are the most popular alternative to stock ownership in the investment world, typically move opposite of the stock market. However, ever since the start of the new year (2020), stocks, bonds, gold and the US Dollar have all been rallying together. Is this a distortion that has developed because of mid-October 2019 Fed announcement of QE? Many think so. If so however, there was a delayed reaction of 2.5 months.
When the Stock Market Goes Down, Gold Goes Up. Right?

During the Jan 19 webinar, Sid showed an intermediate-term chart of Gold and the S&P-500 Index, one overlaid upon the other. The chart clearly showed that gold and the stock market don’t always move inversely, as many seem to believe. Sometimes the two items move opposite each other, but other times they generally move together, in positive correlation. For instance, since early October 2019, the two items have generally been moving to the upside together.
This video clip, taken from that January 19 weekly “Counts” webinar includes Sid’s discussion of the above myth, as well as his chart of Gold vs. the S&P. For those who believe that Gold will “save them” when the stock market crashes next, the video is worthy of consideration.
Are there potential trading profits to be made on both the upside and downside of the S&P as well as Gold? Absolutely. But the two items really should be analyzed and traded independently.
Bonus screenshot from the January 26 weekly webinar. Notice how highly correlated the S&P and the XAU (Gold & Silver Sector Index) have been since early October.
Trading AAPL (Apple Stock) with Precision Timing!
During the June 2 weekly webinar, Sid expected an important bottom was imminent for AAPL. That bottom came in the very next day. From there, Sid predicted a push to the upside for the rest of the month. He stated in the weekly webinar that AAPL would reach a top near the end of July. The stock peaked on July 31 and continued to meticulously follow Sid’s Elliott Wave count.
Trading the DOW with Precision Timing!
In late May, Sid projected a road map for the DOW, calling for an early June bottom and a late July top. Check out this video including excerpts from Sid’s June 2 and June 9, 2019 webinars, which included amazingly accurate calls for the recent multi-week swing low and swing high in the DJIA (Dow Jones Industrial Average):
See How Elliott Waves Help You Avoid “Getting Married to the Trend”

See How Elliott Waves Help You Avoid “Getting Married to the Trend”
Most investors make the mistake of linearly extrapolating a financial trend into the future, especially at junctures when that trend is near a turn.
In everyday terms, it’s called “getting married to the trend.”
Here’s what Elliott Wave International President Robert Prechter said in his book, Prechter’s Perspective:
Seeking Certainty in Uncertain Times? Draw a Trendline | Learn How
Seeking Certainty in Uncertain Times? Draw a Trendline | Learn How
Trendlines are simple straight lines connecting two price extremes on a chart. When you draw more than one, you create a so-called trend channel and see both the future trend and trend reversals.
The Current State of the US Stock Market, the US Dollar, and Gold. A free blog post by Sid Norris of ElliottWavePlus.com
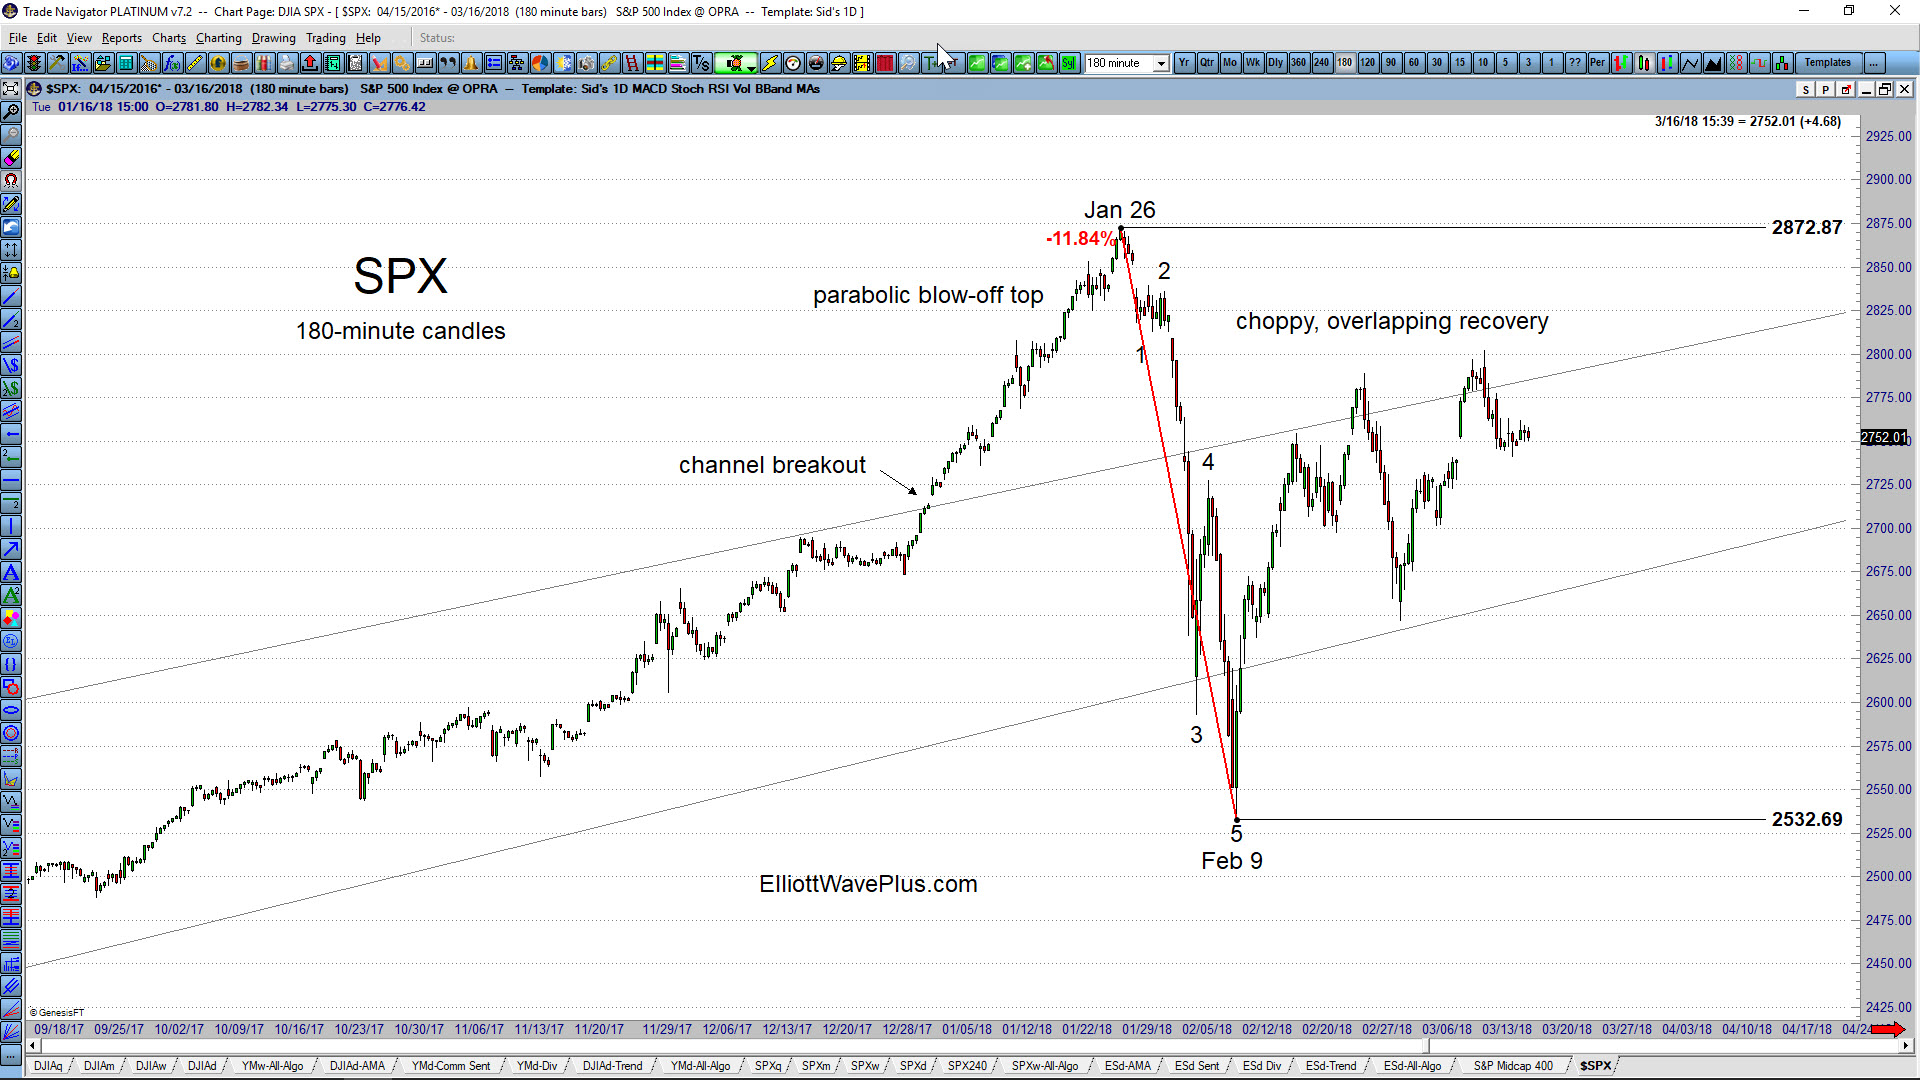
The S&P-500: The January rise in the US stock market went parabolic before topping on January 26. The 11.84% drop over the next 2 weeks (thru February 9) carved out a clear 5-wave impulse to the downside. The recovery so far appears to be choppy, overlapping, and corrective. From an Elliott Wave perspective, the aggressive move down thru Feb 9 is therefore very likely to be a wave 1 of a new downtrend, or a wave A within a 4th wave zigzag. Therefore, another 5-wave wave structure to the downside, taking out the Feb 9 low of 2532.69 would be a high probability expectation. Also possible within Elliott Wave theory is that the drop from Jan 26 thru Feb 9 was wave A within a wave 4 triangle. Only 4 of the 5 legs of a triangle are required to be a zigzag or zigzag combination. One of the legs can be something else, including a 5-wave impulse.
Thoughts on the Current State of the Stock Market (and other stuff) – A blog post by Sid Norris from ElliottWavePlus.com

Without further ado, here are the current combined Hurst projections on several items of interest:
1) US Stock Market: a major top in late 2017 is expected, to be followed by an ABC correction through the year 2024. (And no, I haven’t called the top yet like those super blogging, email blasting, google search manipulators! (-:) From an Elliott Wave perspective, the 5-wave impulse up from the March 2009 low is likely to end soon, though. That bull market will have lasted about 8.5 years, so even if the 2009-2017 bull was a very bullish cycle-degree wave 1 (my main count), a multi-year (cycle-degree) correction would be next.
Elliott Wave Analysis of the S&P-500 (SPX) by Sid from ElliottWavePredictions.com
Elliott Wave Analysis of the S&P-500 (SPX) by Sid from ElliottWavePredictions.com. Click on the chart twice to enlarge. After plunging 12.48% from May 20 through August 24, the S&P-500 it has now recovered over 84% of that drop. Will the rally continue? There are several technical signs the market may be ready to roll over again: […]
Elliott Wave Analysis of 30-Year Treasury Bonds (ZB futures contract) by Sid from ElliottWavePredictions.com
Elliott Wave Analysis of 30-Year Treasury Bonds (ZB futures contract) by Sid from ElliottWavePredictions.com. Click on the charts to enlarge. Taking a short break from the stock market, here’s my current technical analysis of the ZB futures contract (30-year bonds). As shown in the lower left corner of the monthly chart above, the last large-degree […]