Elliott Wave Hub Presentation – June 27, 2023

During this presentation, Sid showed his current wave counts on the Dow Jones Industrial Average, the S&P-500, Bonds, and Gold.
Elliott Wave Hub Presentation
During this presentation, Sid showed his current wave counts on the Dow Jones Industrial Average, the S&P-500, Bonds, and Gold.
Why Our Trading System is Superior to Others
We avoid directional bias by utilizing a combination of dissimilar but robust technical analysis tools and have developed a mix of the specific tools most likely to provide timely trading setups.
The Stock Market is Entering 2023 at a Critical Juncture
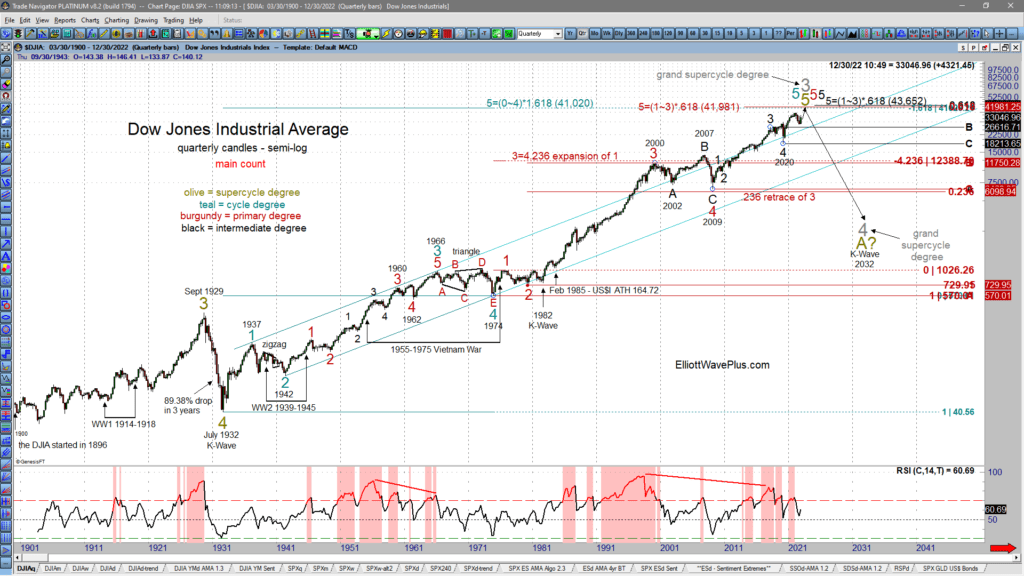
The Stock Market Is Entering 2023 At A Critical Juncture
Summary
There is a cluster of three large-degree Fibonacci targets that suggest that the Dow Jones Industrial Average has not completed 5-waves up from the 1932, 1974 & 2009 lows yet.
The March 2020 low was an intermediate-degree (black) wave 4 low. There are two potential ways the market can finish a 5-wave structure up from that low.
Shorter-term, I’ve been tracking three potential wave counts for the S&P-500. The market could eliminate up to two of those counts during the first few weeks of the new year.
Our method of combining Elliott wave and its associated Fibonacci price targets, Hurst cycle analysis, sentiment extremes, momentum, volume signatures and more provide higher confidence trading forecasts than Elliott wave theory when used alone.
What’s Driving the Markets this Year?
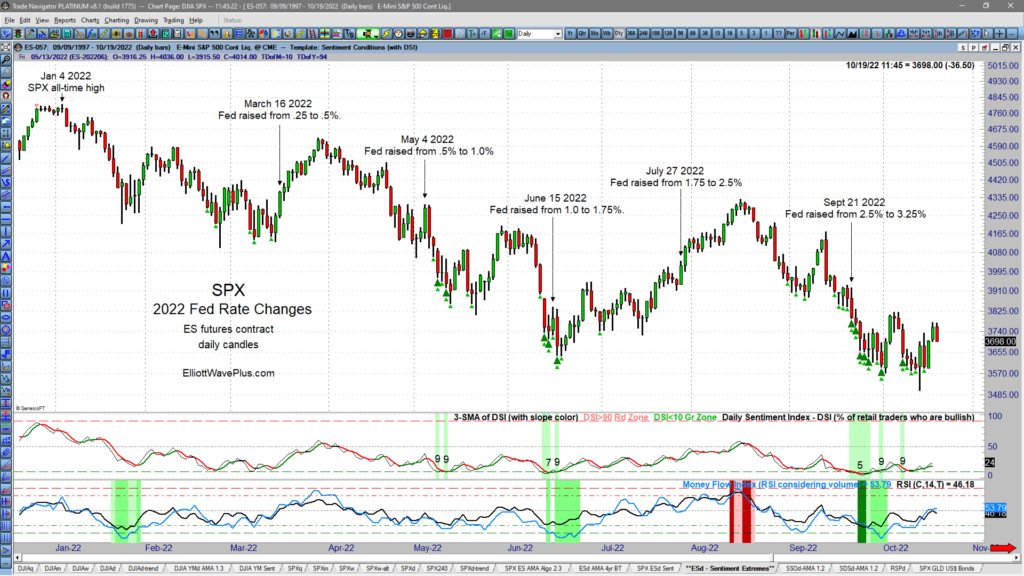
What’s been driving the markets this year? If your market research consists primarily of watching financial television channels, you’d swear that the Fed must be controlling all market movements like it was a puppet master! The vast majority of TV pundits will answer questions about where the market is going next with at least some mention of the Fed. Let’s look at all the Fed’s rate changes so far this year to see if they are producing consistent buy or sell signals for investors and traders.
How to Utilize Elliott Wave Plus

Welcome to the October 2022 Quarterly Premium Plan Webinar. These quarterly events are Elliott Wave Plus’s most anticipated events. Our current subscribers find these recording extremely useful, as do our free visitors at ElliottWavePlus.com. This video and blog will show how to best utilize our service offerings here at Elliott Wave Plus and will help new subscribers decide which subscription tier is right for them.
Accurate Predictive Technical Analysis
Elliott Wave Plus continues its hot streak when it comes to technical analysis and future roadmaps on multiple stocks and sectors.
Quarterly Premium Plan Webinar and Sortable Spreadsheet – Aug 4, 2022
We believe our sentiment condition screenshots are so amazingly valuable to traders, we wanted to spend some time showing viewers how to read those charts, and how to utilize them in your trading. These charts show DSI (retail positioning), and multiple measures of commercials (the producers/hedgers) positioning. As we all know, retail traders are notoriously positioned on the wrong side of trade at major turns. Knowing retail vs commercial is crucial when timing your trades.
Educational Course: Fibonacci Price Targets
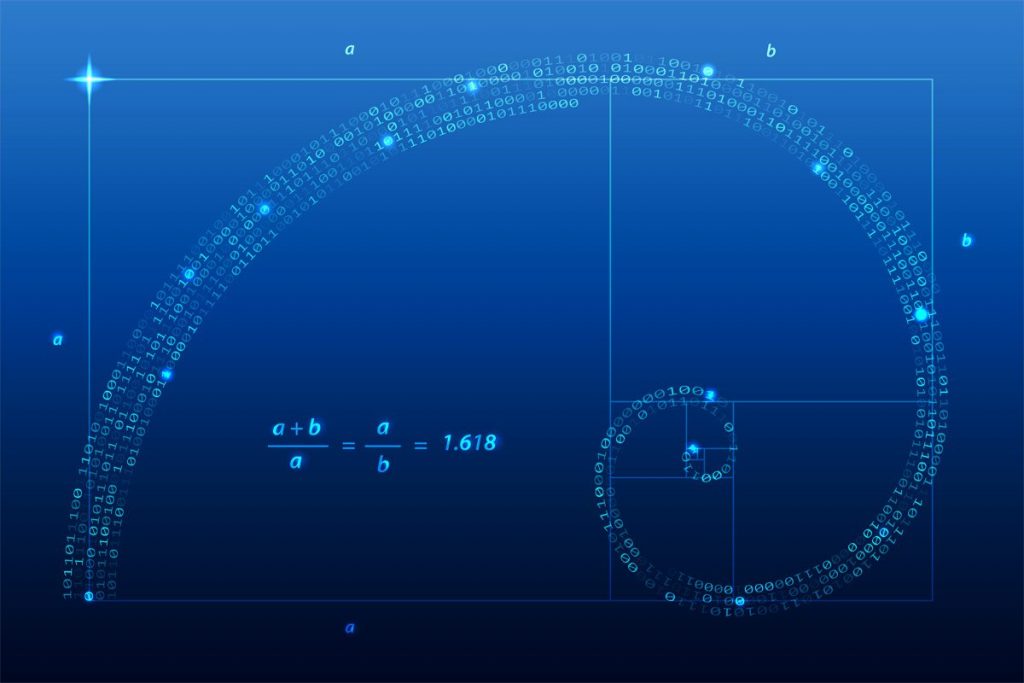
Our friends at Elliott Wave International have allowed us to share some excellent education content with our subscribers! We are happy to share one of their most popular courses, for free. The 4-hour course teaches traders how to use Fibonacci levels to trade with more confidence. We use Fibonacci price targets extensively in our analysis to form our Elliott Wave counts, and we think you should, too.
The Fibonacci sequence provides the mathematical basis of the Elliott Wave Principle. The stock market’s price pattern builds fractally into similar patterns of increasing size. Familiarity with these patterns can prove incredibly useful to investors.
In the course, you’ll learn this and more:
How the Golden Ratio can help you see trading opportunities.
What the most important Fibonacci relationships are.
How Fibonacci relationships can help add confidence to your wave count.
How to project valuable time and price targets using Fibonacci dividers.