Is The Stock Market Losing Upward Momentum?

The most publicized stock market indices continue to hover near all-time highs, but is this market losing momentum? The answer is YES. Examine the following multi-timeframe screenshots of the Dow Jones Industrial Average (DJIA) with a standard RSI indicator on the bottom of the screen. The loss of momentum is clearly shown in the form of bearish RSI divergence.
Is a Dow Theory Non-Confirmation In Play?
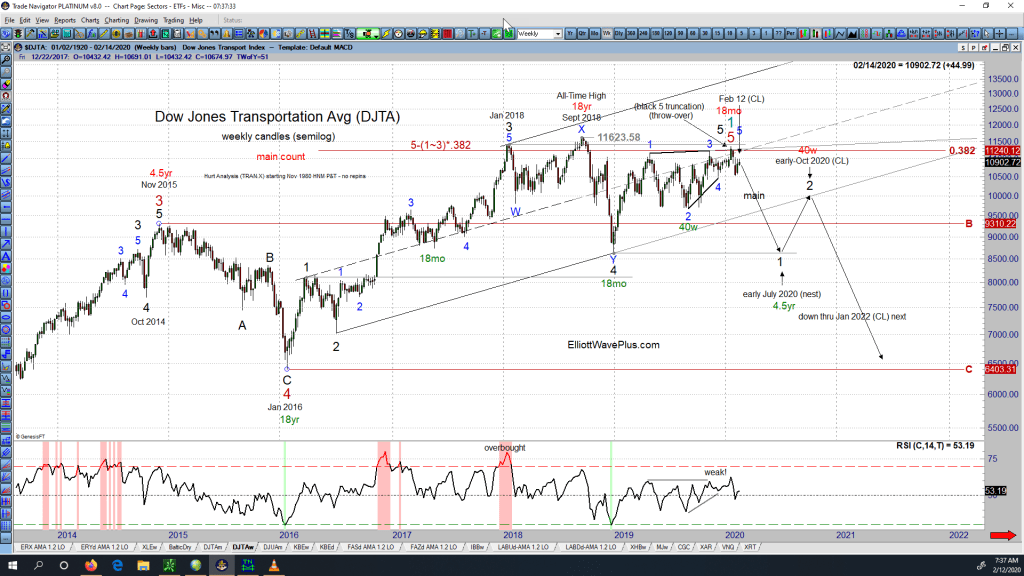
The original Dow Theory states that the market is in an upward trend if either the industrial or transportation index advances above a previous important high and is accompanied or followed by a similar advance in the other average. For example, if the Dow Jones Industrial Average (DJIA) climbs to a new all-time high, and the Dow Jones Transportation Average (DJTA) follows suit within a reasonable period of time, the upward trend is confirmed.
When the Stock Market Goes Down, Gold Goes Up. Right?

During the Jan 19 webinar, Sid showed an intermediate-term chart of Gold and the S&P-500 Index, one overlaid upon the other. The chart clearly showed that gold and the stock market don’t always move inversely, as many seem to believe. Sometimes the two items move opposite each other, but other times they generally move together, in positive correlation. For instance, since early October 2019, the two items have generally been moving to the upside together.
This video clip, taken from that January 19 weekly “Counts” webinar includes Sid’s discussion of the above myth, as well as his chart of Gold vs. the S&P. For those who believe that Gold will “save them” when the stock market crashes next, the video is worthy of consideration.
Are there potential trading profits to be made on both the upside and downside of the S&P as well as Gold? Absolutely. But the two items really should be analyzed and traded independently.
Bonus screenshot from the January 26 weekly webinar. Notice how highly correlated the S&P and the XAU (Gold & Silver Sector Index) have been since early October.
The Quarterly Premium Plan Webinar

Quarterly Premium Plan Webinar 1-17-20. During this free webinar, we cover multiple topics such as:
The different levels of services offered at ElliottWavePlus.com (Crypto Plan, Basic Plan, Pro Plan, and our Premium Plan), How to navigate within our ElliottWavePlus.com website, Helping yourself to our Resources, Our Blog and how to use it, How to utilize our top-tier service – The Premium Plan.
Sid’s Current Analysis on Gold – January 12, 2020

Sid Norris of ElliottwavePlus.com, during the Sunday, January 12, 2020 weekly “counts” webinar for Pro-Plan subscribers describes his Elliott Wave count and associated Fibonacci price targets on Gold.
All About Sid’s Momentum Algo for Elliott Wave Plus Premium and Crypto Plan Subscribers

All About Sid’s Momentum Algo for Elliott Wave Plus Premium and Crypto Plan Subscribers
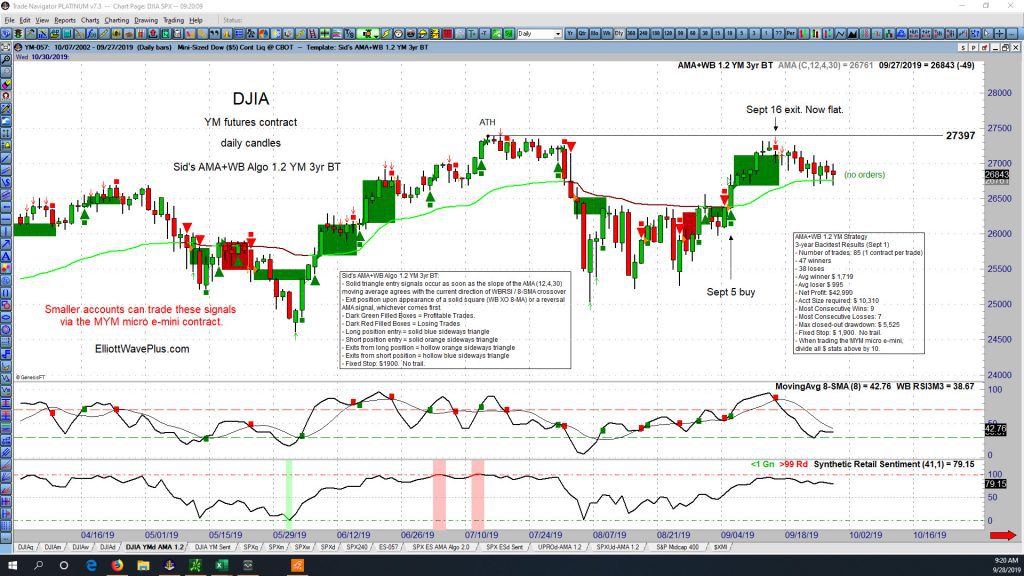
Sid’s Current Algo Statistics and Results (November 2019 Edition)
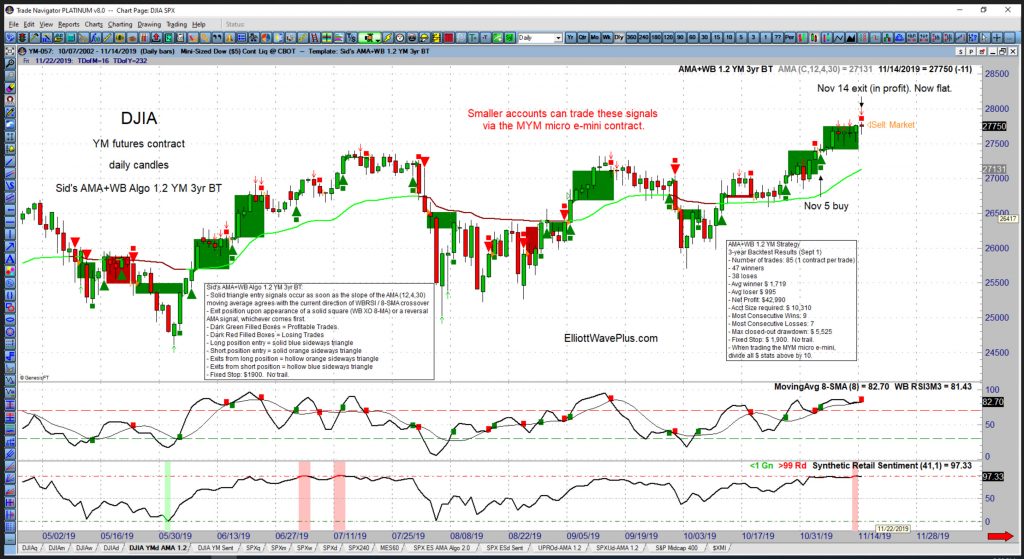
By combining robust methods of technical analysis (Hurst cycle analysis, Elliott wave theory and its associated Fibonacci price targets, extreme sentiment positioning, algorithmic trade signals based on momentum, indicator divergences, etc.), our problem-solving power has increased, providing higher confidence trading opportunities.
How Hurst Cycle Analysis Improves Our Elliott Wave Counts
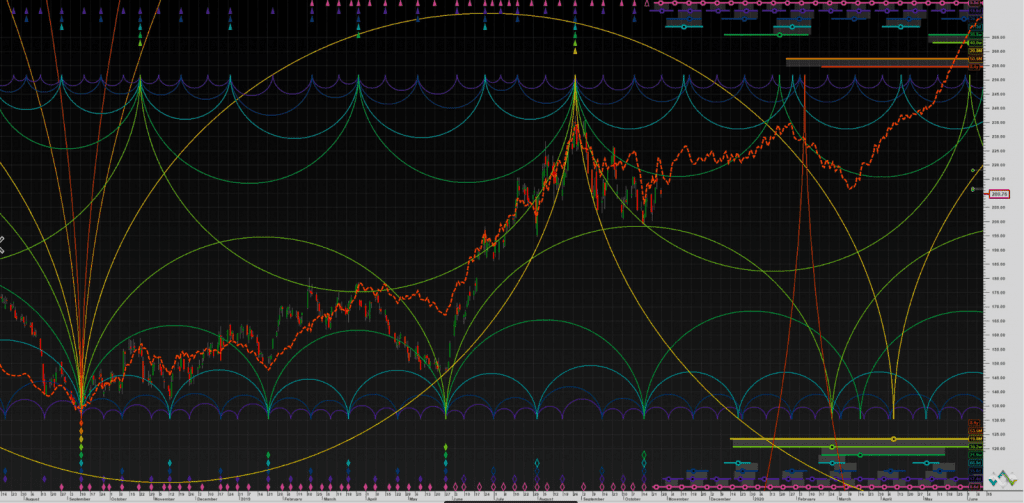
By combining robust methods of technical analysis (Hurst cycle analysis, Elliott wave theory and its associated Fibonacci price targets, extreme sentiment positioning, algorithmic trade signals based on momentum, indicator divergences, etc.), our problem-solving power has increased, providing higher confidence trading opportunities.
The September Sortable Algo Spreadsheet
The Results Are In! Over the past couple of years, we have developed algorithms that provide momentum-based trading signals on over 40 items. We publish three-year backtest results of the algo on those 40 items momthly in the form of a sortable, downloadable spreadsheet.
Trading XLE with Precision using Elliott Wave & Hurst Cycle Analysis

During our August 25, 2019 Weekly “Counts” Webinar, I showed that Hurst cycle analysis was suggesting that a rally was imminent in XLE, the large-cap Oil stock ETF, and the rally was expected to continue through mid-September 2019. XLE bottomed on August 27 and rallied over 14% through September 16.
That rally was well underway when the two Saudi Oil installations were bombed by drones on Saturday, September 14. So which method of predicting trend changes was more effective? Technical analysis, or trading the news? The answer is obvious.