
The Dow Jones Industrial Average is Up Over 1000 Points Since Monday. Did Anyone Predict This Ahead of Time?

As far as I can tell, there were precious few market prognosticators calling for an imminent rally in the stock market just prior to this week’s surge. On the contrary, virtually all article writers and market technicians were projecting the market to move lower. As it turned out, the DJIA was up over 500 points on Tuesday, and is currently up over 1000 points for the week, and it’s only Thursday (June 6). Here’s highlights of my coverage of the DJIA and the VIX from my Sunday, June 2 Weekly “Counts” Webinar:
Trading Bitcoin with Precision Timing! (My calls on Bitcoin since late 2017)

In late 2017, the relentless parabolic move to upside in Bitcoin had caught the attention of the entire trading world. Since that time though, market participants have made OR lost a fortune during the one-year-long 84% crash of Bitcoin, depending on whether they were on the right side of the trade or not. The video below shows my analysis and projections for price movement in Bitcoin since late 2017.
Sid’s Recent Call on GDX (Gold Miners ETF)
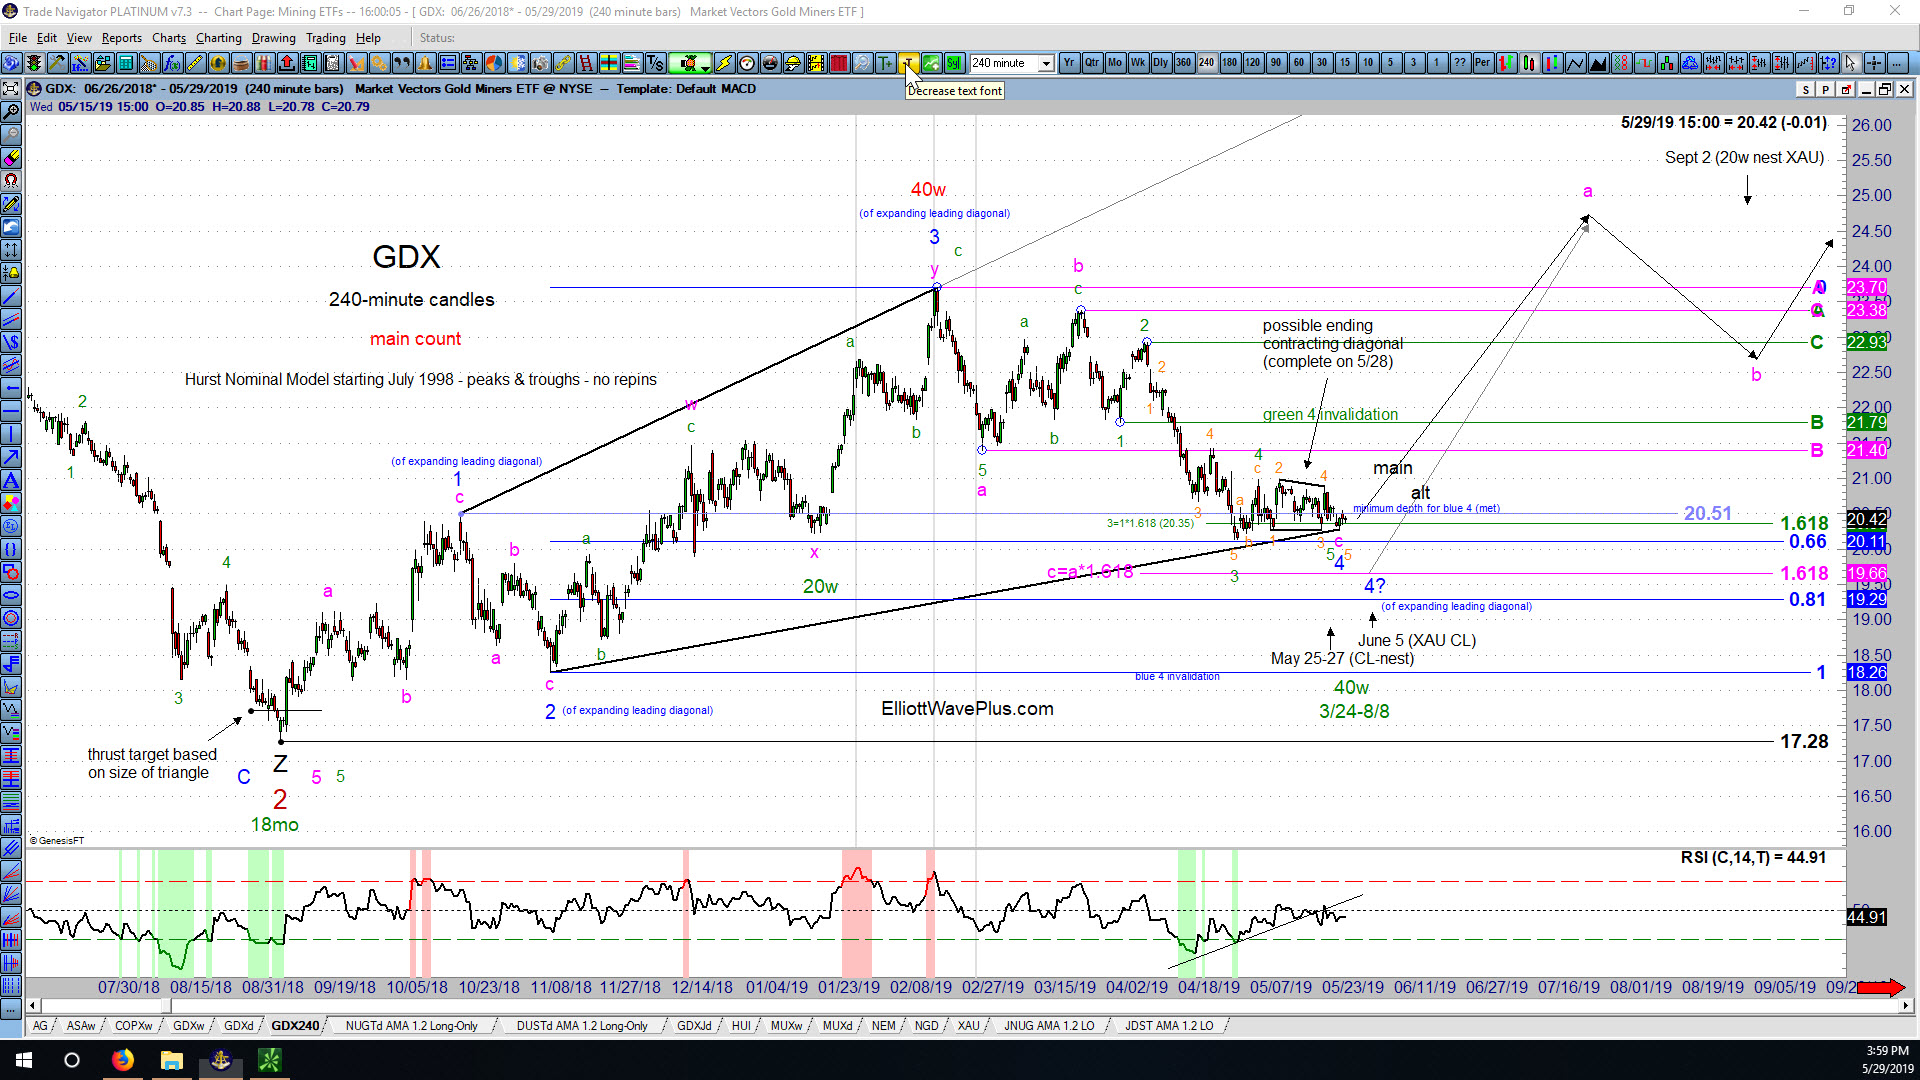
The following screenshot was provided to all Elliott Wave Plus paying subscribers on Wednesday night, May 29, 2019:
Combining Elliott Wave, Fibonacci and Hurst Cycle Analysis to Predict the Future Direction of the Dow Jones Industrial Average

The following charts include my main and alternate wave counts and associated Fibonacci price targets for the Dow Jones Industrial Average, starting with the quarterly, then monthly, weekly and daily charts. Hurst cycle analysis is also utilized at all time frames.
Technical Analysis of the CRB Index (the Commodities Complex) by Sid Norris from ElliottWavePlus.com

The weekly chart (below) of the CRB Index (cash) shows my main Elliott wave count and associated Fibonacci price targets, as well as Cycle analysis, utilizing both the Hurst system and a custom 3.5-year model. (Click on the chart to enlarge).
My Current Analysis of the S&P-500 by Sid Norris from ElliottWavePlus.com

From an Elliott Wave perspective, my top two wave counts are shown. The main count is that an incomplete expanding leading diagonal to the downside is underway starting at the September 21 all-time high. The alternate (shown with question marks) is that an intermediate degree (black) wave 5 to the upside commenced at the December 24 low.
There’s an FOMC meeting and announcement next week. What’s the likely market reaction in silver?

My work as a market technician is generally based on the premise that markets move based on technical aspects derived from prior price action. However, very large players with an agenda (ie: central banks around the globe) are actively involved in the markets. Can looking at both the technical and the influence of the FED provide greater insight into market forecasts? Let’s take a look.
10-Year Treasury Yields Have “Broken Out” to a New Multi-Year High. Will Yields Continue Higher?
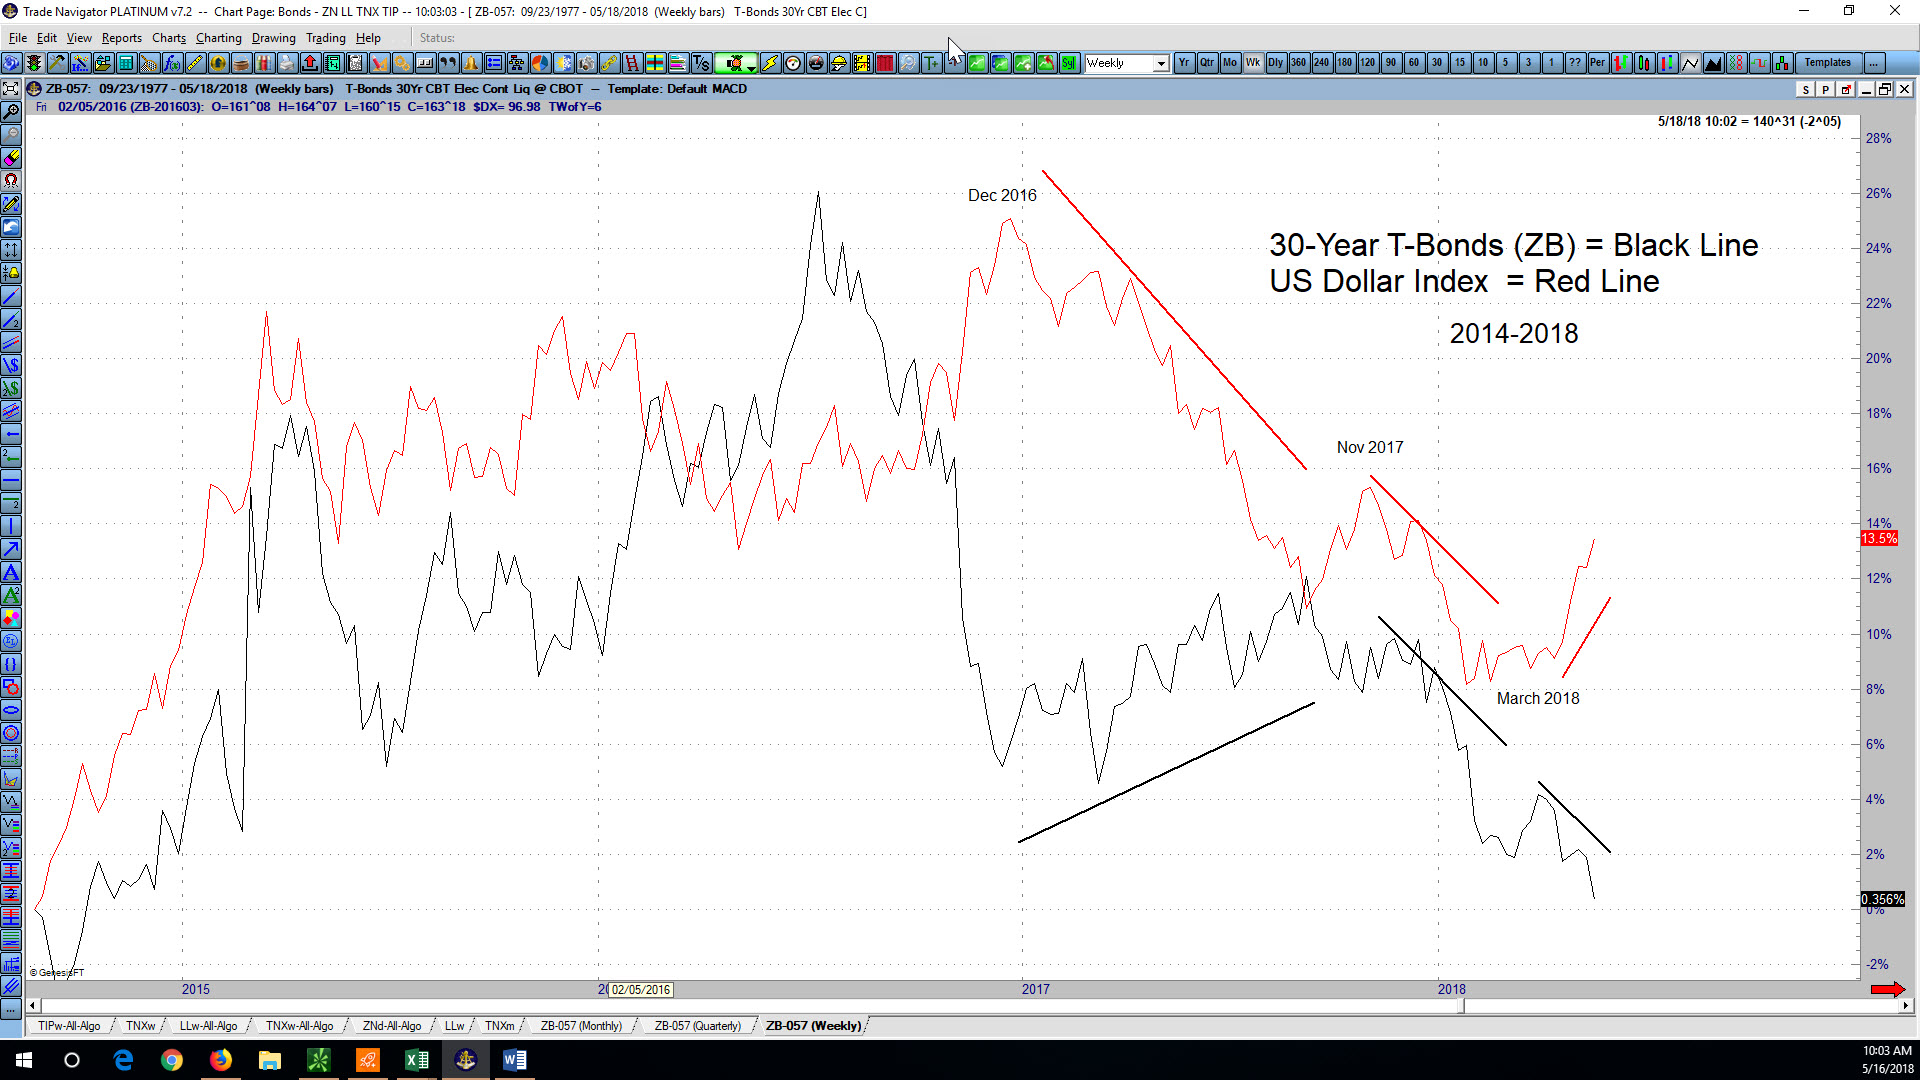
Yesterday’s market jolt, according to the talking heads on financial propaganda TV was due to 10-year treasury yields “breaking out” above their Dec 2013 high. I’m sure this slight new high invalidated a few Elliott Wave counts, and “confirmed” a few others.
How I Eliminated Emotion and Directional Bias from my Elliott Wave Counts – A blog post by Sid Norris of ElliottWavePlus.com
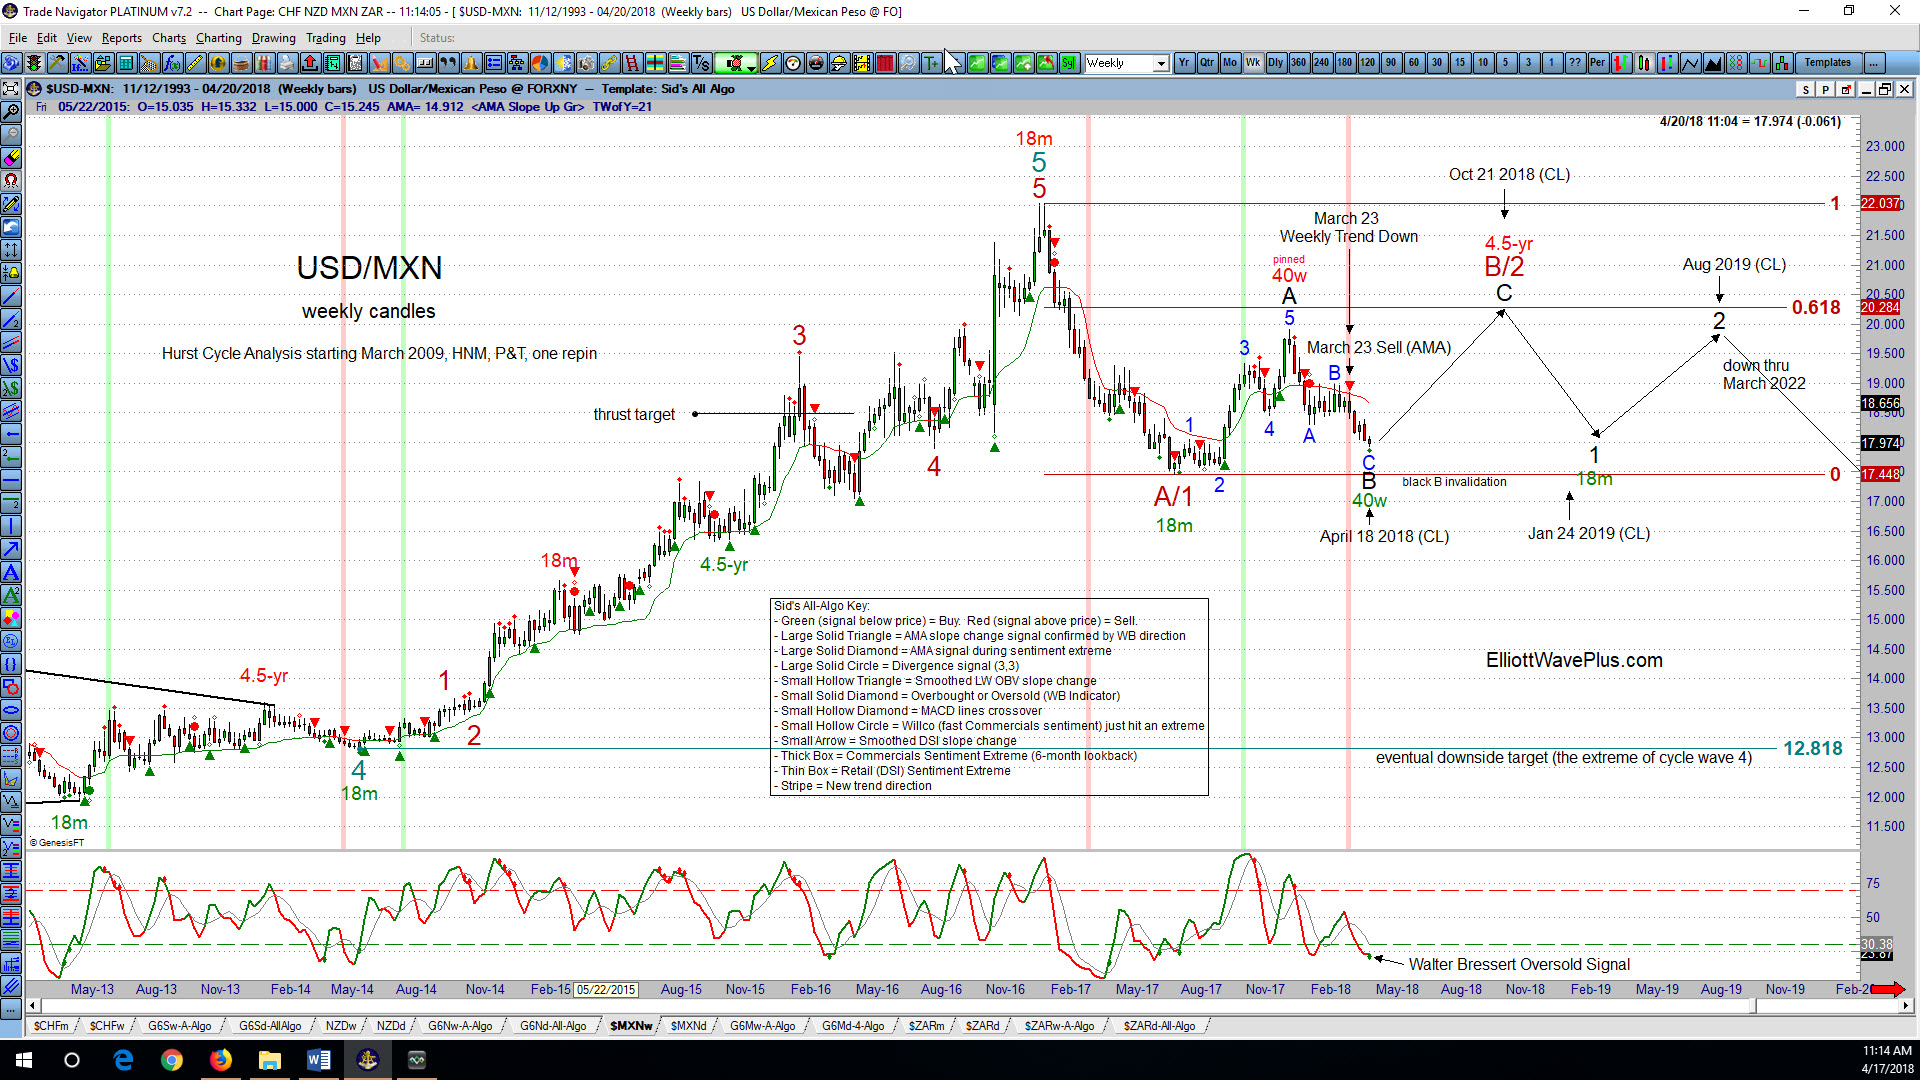
I’ve been labeling charts using Elliott Wave theory for a very long time. I’ve also always tracked the Elliott Wave interpretations (wave counts) from several published wave counters over the years. Almost everyone familiar with Elliott Wave theory knows that . .
The Current State of the US Stock Market, the US Dollar, and Gold. A free blog post by Sid Norris of ElliottWavePlus.com
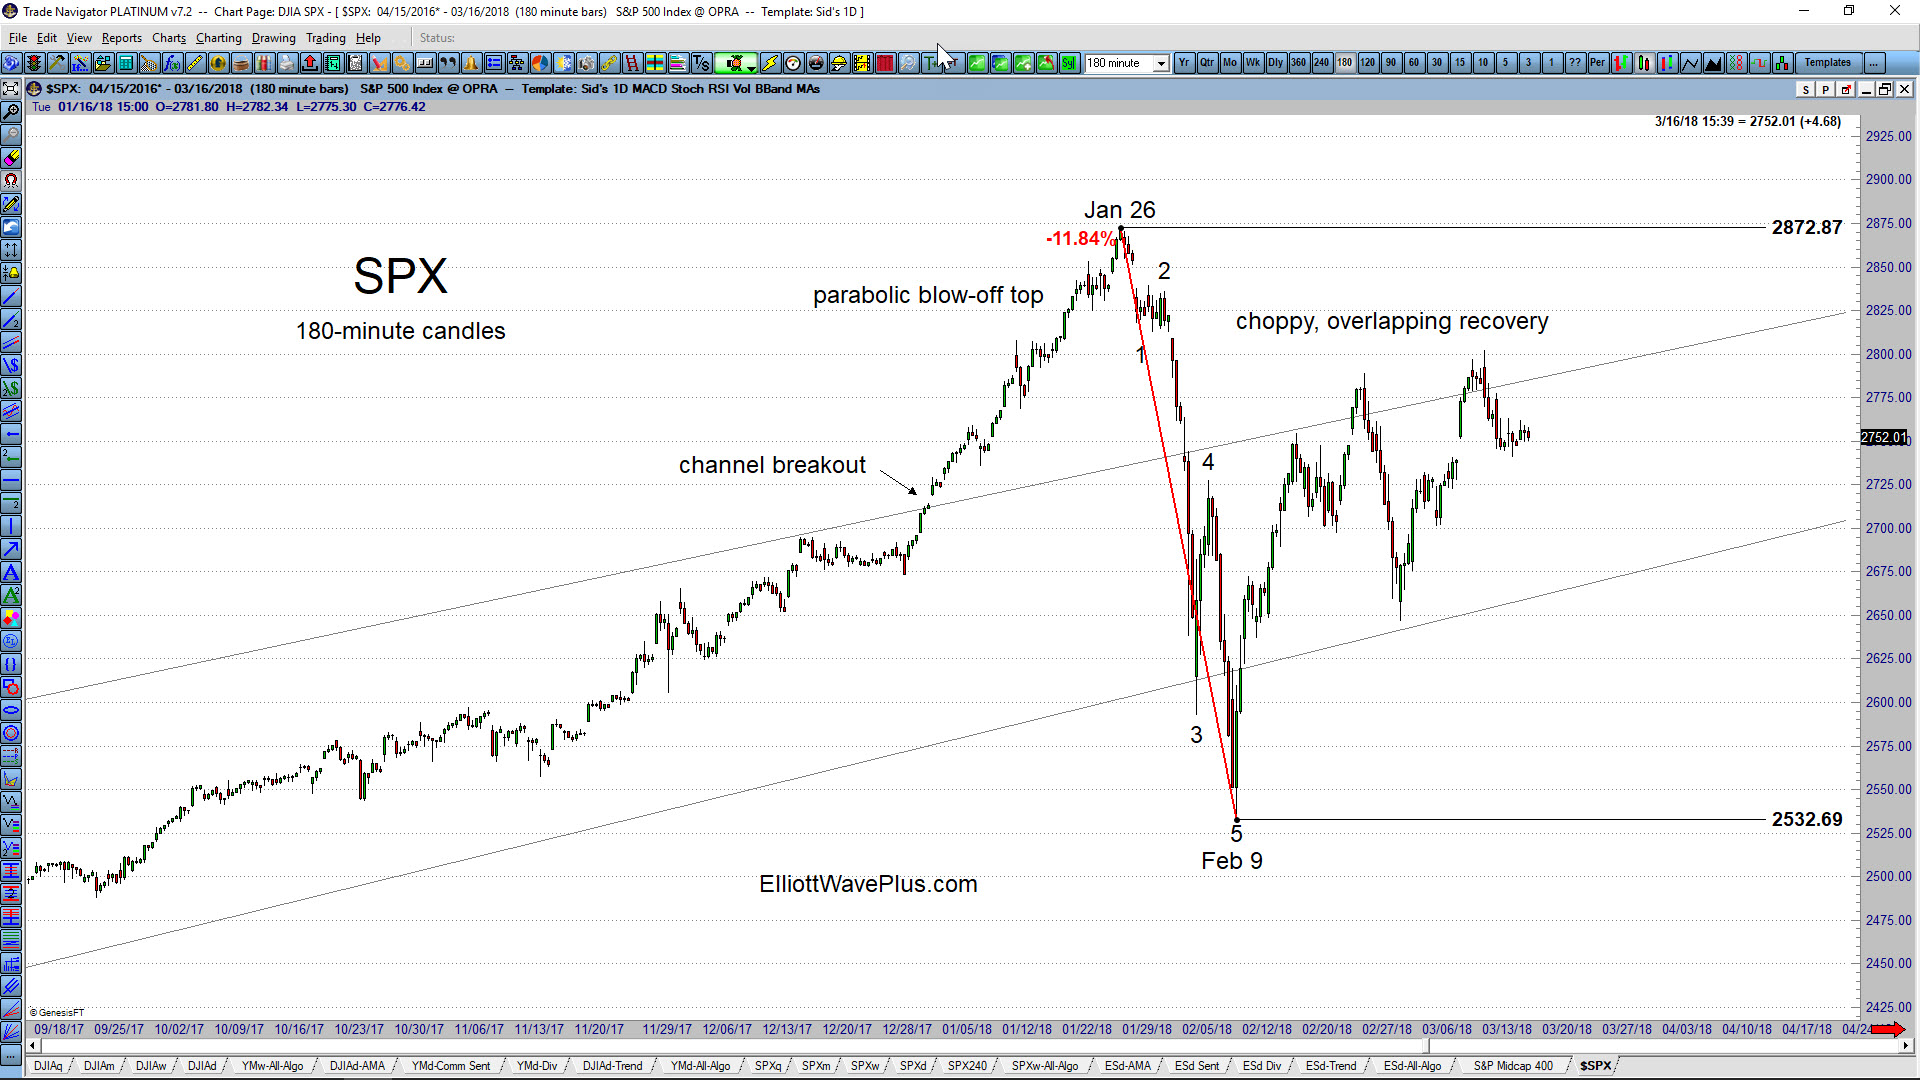
The S&P-500: The January rise in the US stock market went parabolic before topping on January 26. The 11.84% drop over the next 2 weeks (thru February 9) carved out a clear 5-wave impulse to the downside. The recovery so far appears to be choppy, overlapping, and corrective. From an Elliott Wave perspective, the aggressive move down thru Feb 9 is therefore very likely to be a wave 1 of a new downtrend, or a wave A within a 4th wave zigzag. Therefore, another 5-wave wave structure to the downside, taking out the Feb 9 low of 2532.69 would be a high probability expectation. Also possible within Elliott Wave theory is that the drop from Jan 26 thru Feb 9 was wave A within a wave 4 triangle. Only 4 of the 5 legs of a triangle are required to be a zigzag or zigzag combination. One of the legs can be something else, including a 5-wave impulse.